تم تحديثه
STORJ analysis (12H)
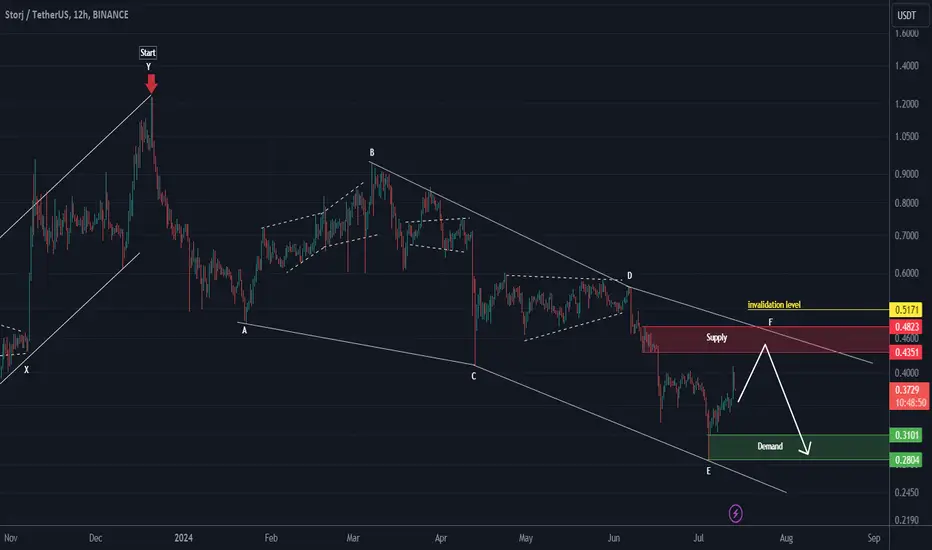
From where we put the red arrow on the chart, STORJ correction has started.
It looks like our pattern is a diametric.
The red area is where we look for sell/short positions.
The target can be the green box.
Closing a daily candle below the invalidation level will violate the analysis.
For risk management, please don't forget stop loss and capital management
Comment if you have any questions
Thank You
تم فتح الصفقة
reached the red range.It is better to look for buy/long positions on Storj, not sell/short
If it returns to the green range, we will enter the buy/long position
أغلقت الصفقة: تم الوصول للهدف
By hitting the green zone, it pumped more than 28%
🔥 Don't Just Watch the Market. Understand It!
📊 Crypto Analysis & Setups:
👉 t.me/Behdark_EN
💹 Forex Analysis & Setups:
👉 t.me/FX_Behdark
🚀 Join BehDark for Market Insights, Trading Setups & Key Levels. Choose Your Market & Join Us!
📊 Crypto Analysis & Setups:
👉 t.me/Behdark_EN
💹 Forex Analysis & Setups:
👉 t.me/FX_Behdark
🚀 Join BehDark for Market Insights, Trading Setups & Key Levels. Choose Your Market & Join Us!
إخلاء المسؤولية
لا يُقصد بالمعلومات والمنشورات أن تكون، أو تشكل، أي نصيحة مالية أو استثمارية أو تجارية أو أنواع أخرى من النصائح أو التوصيات المقدمة أو المعتمدة من TradingView. اقرأ المزيد في شروط الاستخدام.