شراء
SYNUSDT: Breaking Long-Term Downtrend, Poised for a Major Rally?
Firstly, our Algo-based indicators are used to create this analysis. Follow me so you don't miss, Boost and leave your comments if you profited with our posts, so we may continue:
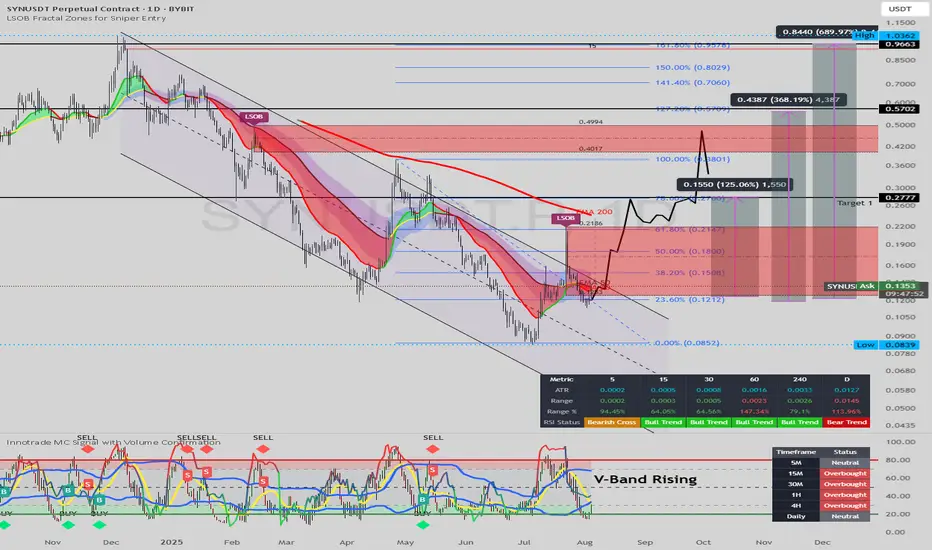
This daily chart for SYNUSDT showcases a significant technical development as the price appears to be breaking out of a multi-month descending channel, signaling a potential major trend reversal.
Analysis:
Descending Channel Breakout: The price has been confined within a clear descending channel for most of the year. The recent price action shows a decisive push above the upper boundary of this channel. It is currently consolidating right above this broken trendline, which is a classic "breakout-and-retest" pattern.
Key Support: The current price is finding support at the 23.6% Fibonacci retracement level (around $0.1212). A successful hold above this level would reinforce the bullish breakout.
Momentum Indicator: The Innotrade MC Signal at the bottom provides strong confluence. The indicator is sharply rising from the oversold "BUY" zone in a pattern labeled "V-Band Rising," which suggests a powerful burst of bullish momentum from a bottom.
Price Projection and Targets: The illustrated price path anticipates a strong upward move following this retest phase.
The first major area of resistance to watch is the zone between the 61.8% Fib level (0.2147)
𝑎
𝑛
𝑑
𝑡
ℎ
𝑒
78.6, (0.2147). This area also contains a previous order block (LSOB) and the EMA 200.
Target 1: is explicitly marked at $0.2777.
Higher targets based on Fibonacci extensions are noted at $0.5709 and above for the longer term.
Strategy:
Position: Long (Buy)
Entry: The current price level, retesting the broken channel trendline (around $0.12 - $0.14), presents a strategic entry point.
Targets: The initial primary target is $0.2777, with further long-term potential if bullish momentum is sustained.
Conclusion:
The combination of a breakout from a long-term bearish structure, a successful retest of support, and powerful momentum indicators suggests that SYNUSDT could be at the beginning of a new, significant uptrend. The current price offers a favorable risk-to-reward entry for a move towards the identified targets.
Disclaimer: This analysis is for educational purposes only and should not be considered financial advice. Always conduct your own research and manage risk appropriately.
This daily chart for SYNUSDT showcases a significant technical development as the price appears to be breaking out of a multi-month descending channel, signaling a potential major trend reversal.
Analysis:
Descending Channel Breakout: The price has been confined within a clear descending channel for most of the year. The recent price action shows a decisive push above the upper boundary of this channel. It is currently consolidating right above this broken trendline, which is a classic "breakout-and-retest" pattern.
Key Support: The current price is finding support at the 23.6% Fibonacci retracement level (around $0.1212). A successful hold above this level would reinforce the bullish breakout.
Momentum Indicator: The Innotrade MC Signal at the bottom provides strong confluence. The indicator is sharply rising from the oversold "BUY" zone in a pattern labeled "V-Band Rising," which suggests a powerful burst of bullish momentum from a bottom.
Price Projection and Targets: The illustrated price path anticipates a strong upward move following this retest phase.
The first major area of resistance to watch is the zone between the 61.8% Fib level (0.2147)
𝑎
𝑛
𝑑
𝑡
ℎ
𝑒
78.6, (0.2147). This area also contains a previous order block (LSOB) and the EMA 200.
Target 1: is explicitly marked at $0.2777.
Higher targets based on Fibonacci extensions are noted at $0.5709 and above for the longer term.
Strategy:
Position: Long (Buy)
Entry: The current price level, retesting the broken channel trendline (around $0.12 - $0.14), presents a strategic entry point.
Targets: The initial primary target is $0.2777, with further long-term potential if bullish momentum is sustained.
Conclusion:
The combination of a breakout from a long-term bearish structure, a successful retest of support, and powerful momentum indicators suggests that SYNUSDT could be at the beginning of a new, significant uptrend. The current price offers a favorable risk-to-reward entry for a move towards the identified targets.
Disclaimer: This analysis is for educational purposes only and should not be considered financial advice. Always conduct your own research and manage risk appropriately.

إخلاء المسؤولية
لا يُقصد بالمعلومات والمنشورات أن تكون، أو تشكل، أي نصيحة مالية أو استثمارية أو تجارية أو أنواع أخرى من النصائح أو التوصيات المقدمة أو المعتمدة من TradingView. اقرأ المزيد في شروط الاستخدام.
إخلاء المسؤولية
لا يُقصد بالمعلومات والمنشورات أن تكون، أو تشكل، أي نصيحة مالية أو استثمارية أو تجارية أو أنواع أخرى من النصائح أو التوصيات المقدمة أو المعتمدة من TradingView. اقرأ المزيد في شروط الاستخدام.