
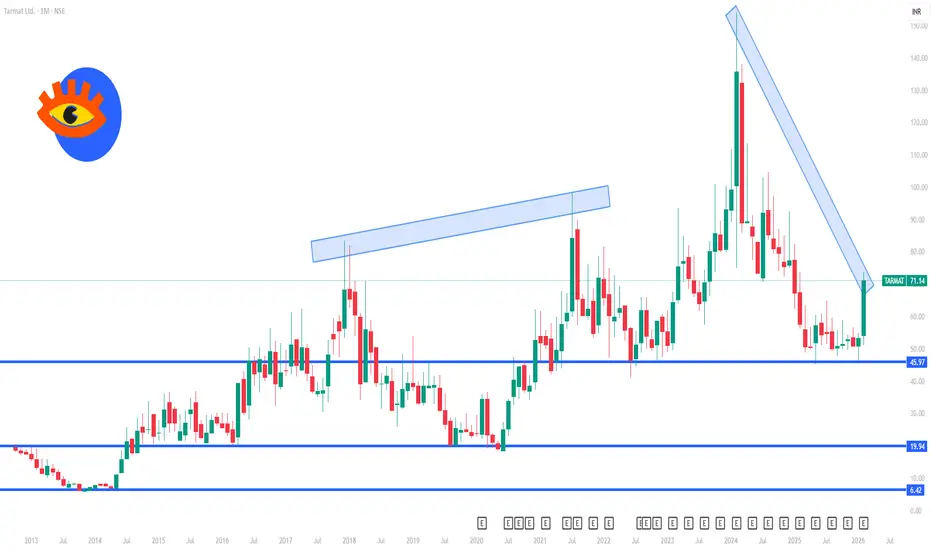
📍 Current Price Context (Latest NSE Data)
Current price: ~₹64–₹72 range in recent sessions, with strong volatility and upside moves reported.
52-week range: ~₹45–₹74 (recent high near ₹73–₹74).
Note: Different data providers show slightly varied latest price prints — indicating active recent volatility.
📊 1-Month Technical Levels (Support & Resistance)
(These levels are derived from daily pivot analysis and classic technical support/resistance calculations)
🔹 Resistance Levels (Upside Targets)
R1: ~₹55–₹56 — near short-term range top.
R2: ~₹58–₹59 — next structural resistance.
R3: ~₹61–₹63 — broader breakout zone within 1-month range.
Higher resistance: ₹68–₹72+ — if strong momentum continues beyond near-term levels.
🔻 Support Levels (Downside Floors)
S1: ~₹52–₹53 — first major support zone.
S2: ~₹49–₹50 — deeper retracement support.
S3: ~₹46–₹48 — stronger lower support range from past 1-month structure.
Pivot reference: ~₹54–₹55 — roughly mid-point of recent price action; acts as sentiment pivot for swings.
📈 Short-Term Trend & Indicator Signals
Multiple real-time technical tools show shifting momentum over 1 month:
Bullish Signals
Long-term moving averages (20, 50, 100, 200) trending below current price, indicating strong uptrend bias.
Strong RSI and momentum readings in recent sessions suggesting upside acceleration if price holds above pivot.
Neutral / Mixed Signals
Some classic pivot and shorter time frame oscillators show resistance challenges around ₹61–₹63 — potential consolidation zone.
Bearish or Risk Signals
RSI can reach overbought levels on short time frames — risks pullback towards support zones if upside momentum fades.
📅 1-Month Technical Bias Summary
Bullish Scenario (if price stays above pivot ~₹54–₹55):
Break above ₹58–₹59 → targets ₹61–₹63 and then broader highs near ₹68+.
Neutral / Sideways Action:
Trading between ₹52–₹58, with consolidation around pivot.
Bearish Scenario (if breaks down below ~₹52):
Deeper retracement towards ₹49–₹48, and possibly to ₹46+ if market weakens.
📌 Trading Tip (1-Month View)
Keep stops near S1 and S2 for short positions;
Targets near R1/R2/R3 for long trades above pivot;
Volume confirmation and RSI divergence can help confirm trend continuation or reversal.
Current price: ~₹64–₹72 range in recent sessions, with strong volatility and upside moves reported.
52-week range: ~₹45–₹74 (recent high near ₹73–₹74).
Note: Different data providers show slightly varied latest price prints — indicating active recent volatility.
📊 1-Month Technical Levels (Support & Resistance)
(These levels are derived from daily pivot analysis and classic technical support/resistance calculations)
🔹 Resistance Levels (Upside Targets)
R1: ~₹55–₹56 — near short-term range top.
R2: ~₹58–₹59 — next structural resistance.
R3: ~₹61–₹63 — broader breakout zone within 1-month range.
Higher resistance: ₹68–₹72+ — if strong momentum continues beyond near-term levels.
🔻 Support Levels (Downside Floors)
S1: ~₹52–₹53 — first major support zone.
S2: ~₹49–₹50 — deeper retracement support.
S3: ~₹46–₹48 — stronger lower support range from past 1-month structure.
Pivot reference: ~₹54–₹55 — roughly mid-point of recent price action; acts as sentiment pivot for swings.
📈 Short-Term Trend & Indicator Signals
Multiple real-time technical tools show shifting momentum over 1 month:
Bullish Signals
Long-term moving averages (20, 50, 100, 200) trending below current price, indicating strong uptrend bias.
Strong RSI and momentum readings in recent sessions suggesting upside acceleration if price holds above pivot.
Neutral / Mixed Signals
Some classic pivot and shorter time frame oscillators show resistance challenges around ₹61–₹63 — potential consolidation zone.
Bearish or Risk Signals
RSI can reach overbought levels on short time frames — risks pullback towards support zones if upside momentum fades.
📅 1-Month Technical Bias Summary
Bullish Scenario (if price stays above pivot ~₹54–₹55):
Break above ₹58–₹59 → targets ₹61–₹63 and then broader highs near ₹68+.
Neutral / Sideways Action:
Trading between ₹52–₹58, with consolidation around pivot.
Bearish Scenario (if breaks down below ~₹52):
Deeper retracement towards ₹49–₹48, and possibly to ₹46+ if market weakens.
📌 Trading Tip (1-Month View)
Keep stops near S1 and S2 for short positions;
Targets near R1/R2/R3 for long trades above pivot;
Volume confirmation and RSI divergence can help confirm trend continuation or reversal.

Contact Knowledgehub for a detailed consultation: Dm on WhatsApp: [wa.link/a2o0kz]-
Phone No: [+91 93102 26243]-
Email: [tradingviewknowledgehub@gmail.com]---
-- Let’s achieve success together!
Phone No: [+91 93102 26243]-
Email: [tradingviewknowledgehub@gmail.com]---
-- Let’s achieve success together!
منشورات ذات صلة
إخلاء المسؤولية
لا يُقصد بالمعلومات والمنشورات أن تكون، أو تشكل، أي نصيحة مالية أو استثمارية أو تجارية أو أنواع أخرى من النصائح أو التوصيات المقدمة أو المعتمدة من TradingView. اقرأ المزيد في شروط الاستخدام.
Contact Knowledgehub for a detailed consultation: Dm on WhatsApp: [wa.link/a2o0kz]-
Phone No: [+91 93102 26243]-
Email: [tradingviewknowledgehub@gmail.com]---
-- Let’s achieve success together!
Phone No: [+91 93102 26243]-
Email: [tradingviewknowledgehub@gmail.com]---
-- Let’s achieve success together!
منشورات ذات صلة
إخلاء المسؤولية
لا يُقصد بالمعلومات والمنشورات أن تكون، أو تشكل، أي نصيحة مالية أو استثمارية أو تجارية أو أنواع أخرى من النصائح أو التوصيات المقدمة أو المعتمدة من TradingView. اقرأ المزيد في شروط الاستخدام.