
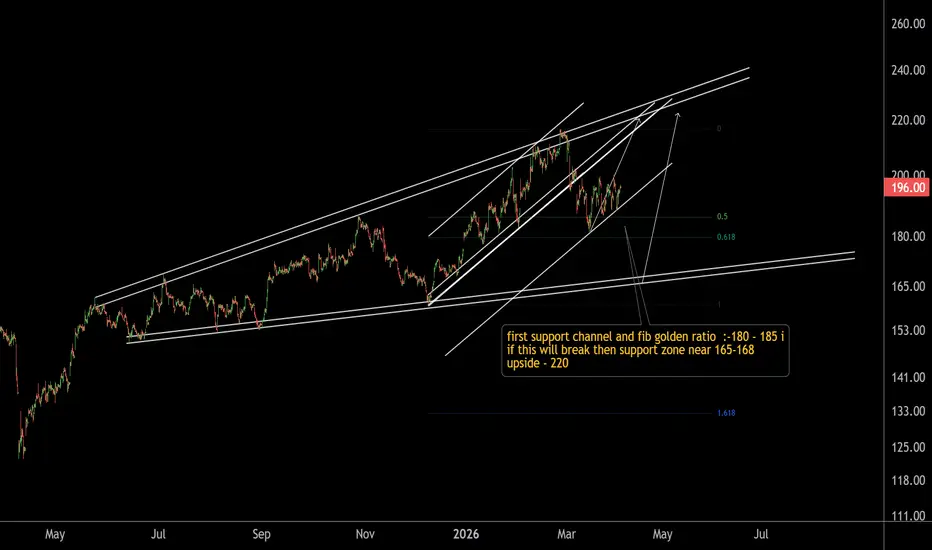
This is the 1-hour timeframe chart of Tata Steel.
The stock is showing a strong support zone based on two factors:
A short-term channel support
Fibonacci retracement support near the 180–185 zone
If the stock breaks below this level, the next support lies in the 165–168 range.
However, if the support zone sustains, we can expect an upside move towards 220–240.
Thank you.
The stock is showing a strong support zone based on two factors:
A short-term channel support
Fibonacci retracement support near the 180–185 zone
If the stock breaks below this level, the next support lies in the 165–168 range.
However, if the support zone sustains, we can expect an upside move towards 220–240.
Thank you.

@RahulSarawagi
Connect us at optionlab.co.in/
Connect us at optionlab.co.in/
إخلاء المسؤولية
لا يُقصد بالمعلومات والمنشورات أن تكون، أو تشكل، أي نصيحة مالية أو استثمارية أو تجارية أو أنواع أخرى من النصائح أو التوصيات المقدمة أو المعتمدة من TradingView. اقرأ المزيد في شروط الاستخدام.
@RahulSarawagi
Connect us at optionlab.co.in/
Connect us at optionlab.co.in/
إخلاء المسؤولية
لا يُقصد بالمعلومات والمنشورات أن تكون، أو تشكل، أي نصيحة مالية أو استثمارية أو تجارية أو أنواع أخرى من النصائح أو التوصيات المقدمة أو المعتمدة من TradingView. اقرأ المزيد في شروط الاستخدام.