
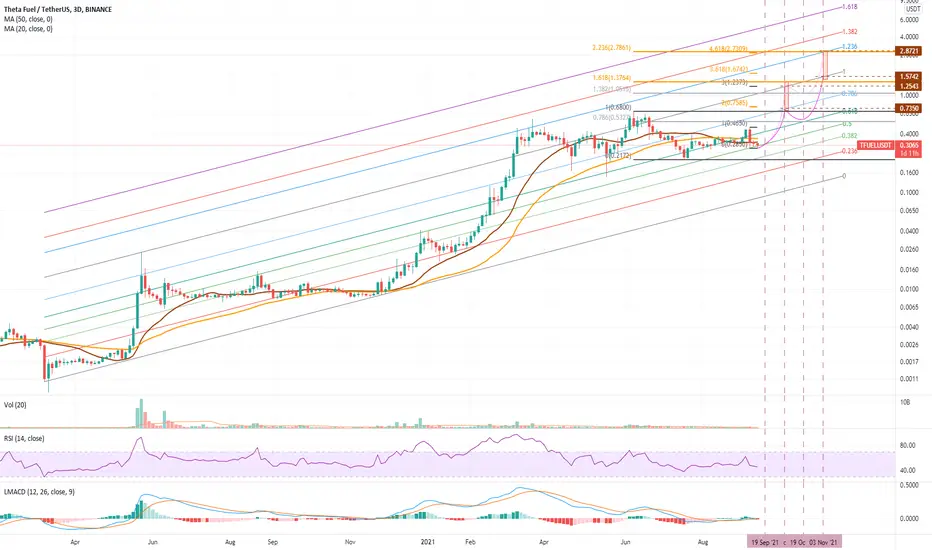
Re-running the TFUEL study in the Logarithmic scale and we see some clear and consistent structure to the market along the lines of a Fibonacci Channel.
Considering the completion of Wave 2 yesterday, this 3 Day Chart provides some insight and justification for higher targets for Wave 5.
Which do you think is more likely, the outcomes derived from previous Standard Scale chart or this Log Scale chart?
Considering the completion of Wave 2 yesterday, this 3 Day Chart provides some insight and justification for higher targets for Wave 5.
Which do you think is more likely, the outcomes derived from previous Standard Scale chart or this Log Scale chart?

منشورات ذات صلة
إخلاء المسؤولية
لا يُقصد بالمعلومات والمنشورات أن تكون، أو تشكل، أي نصيحة مالية أو استثمارية أو تجارية أو أنواع أخرى من النصائح أو التوصيات المقدمة أو المعتمدة من TradingView. اقرأ المزيد في شروط الاستخدام.
منشورات ذات صلة
إخلاء المسؤولية
لا يُقصد بالمعلومات والمنشورات أن تكون، أو تشكل، أي نصيحة مالية أو استثمارية أو تجارية أو أنواع أخرى من النصائح أو التوصيات المقدمة أو المعتمدة من TradingView. اقرأ المزيد في شروط الاستخدام.