
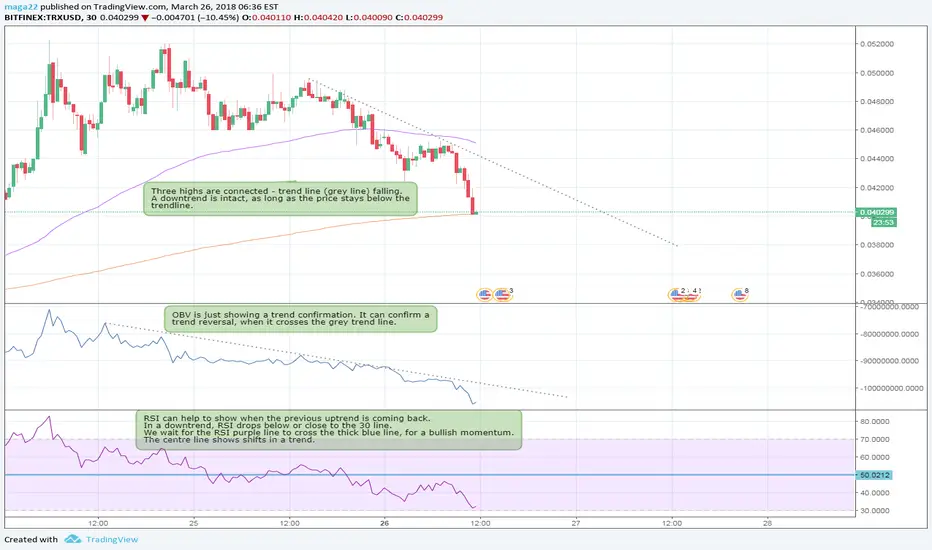
Everything confirms and shows a downtrend, but looking at the trendlines and centre line for the RSI indicator. It seems that we can perhaps hope for a reversal soon
IF
1.Candle stick crosses the grey dotted line and we see higher highs.
2.OBV line crosses grey dotted line and we see an increase
3.RSI crosses centre line (50) for a bullish momentum.
Do you agree with me? If not, please let me know how you would analyse it.
Thanks!
IF
1.Candle stick crosses the grey dotted line and we see higher highs.
2.OBV line crosses grey dotted line and we see an increase
3.RSI crosses centre line (50) for a bullish momentum.
Do you agree with me? If not, please let me know how you would analyse it.
Thanks!

إخلاء المسؤولية
لا يُقصد بالمعلومات والمنشورات أن تكون، أو تشكل، أي نصيحة مالية أو استثمارية أو تجارية أو أنواع أخرى من النصائح أو التوصيات المقدمة أو المعتمدة من TradingView. اقرأ المزيد في شروط الاستخدام.
إخلاء المسؤولية
لا يُقصد بالمعلومات والمنشورات أن تكون، أو تشكل، أي نصيحة مالية أو استثمارية أو تجارية أو أنواع أخرى من النصائح أو التوصيات المقدمة أو المعتمدة من TradingView. اقرأ المزيد في شروط الاستخدام.