
Sometimes the important part of a breakout isn't the breakout itself...
It's what happens after the breakout.
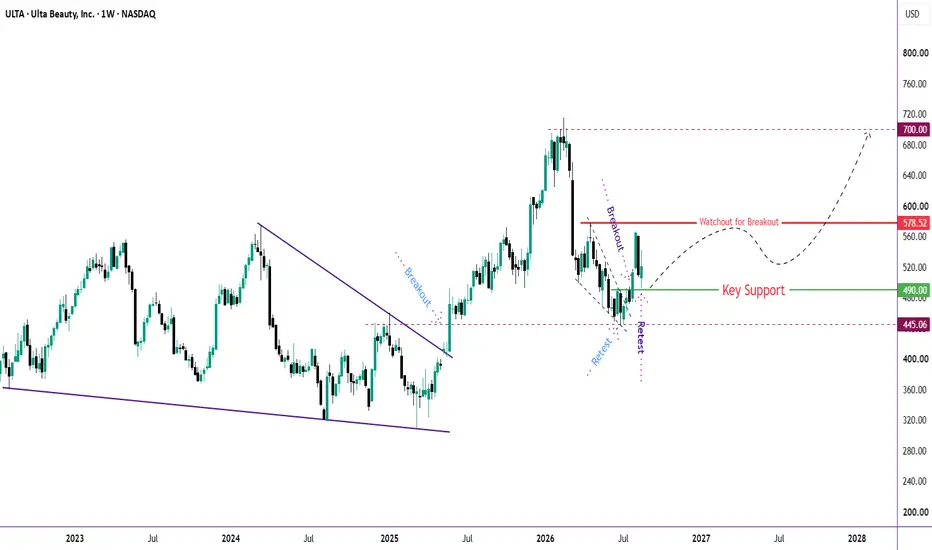
ULTA has been giving us an interesting sequence:
🔹 Broke out of the long-term falling structure
🔹 Ran all the way above $700
🔹 Pulled back sharply
🔹 Returned to $445 — the previous breakout level
🔹 Successfully retested that zone
🔹 Recovered and broke above $490
🔹 Reached $565
🔹 And now pulled back to retest the $490–500 area
And this is where the chart gets interesting. 👀
🧩 The latest candle
The weekly candle has formed a doji around the $495 area, almost exactly where the previous breakout occurred.
That doesn't guarantee a reversal.
But after a pullback into a former resistance-turned-support zone, a doji can indicate that selling pressure is losing momentum and buyers are beginning to defend the level.
So I'm watching the next candle for confirmation.
🎯 Levels I'm watching
🟢 $490–500 — Key support / retest zone
If this area holds:
➡️ $565 — first resistance
➡️ $578 — major resistance
➡️ $700 — previous ATH / major target
And if price eventually clears the ATH with strength...
🚀 Discovery mode begins.
⚠️ What would invalidate the setup?
A sustained move back below the $490 area would weaken the bullish continuation thesis.
And a deeper break below $445 would be much more concerning, because that would mean the previous breakout/retest structure is failing.
🔥 The bigger picture
What I like here is the structure:
Breakout → Deep correction → Retest → Recovery → Breakout → Retest
That's exactly the kind of sequence I want to see in a healthy bullish continuation.
Now the question is:
Was $565 merely the first bounce... or the beginning of the next leg higher?
I'm watching $490–500 very closely.
Hold the retest → reclaim $565 → challenge $578 → ATH back in sight. 👀📈
Not a prediction. The levels are the confirmation points.
It's what happens after the breakout.
ULTA has been giving us an interesting sequence:
🔹 Broke out of the long-term falling structure
🔹 Ran all the way above $700
🔹 Pulled back sharply
🔹 Returned to $445 — the previous breakout level
🔹 Successfully retested that zone
🔹 Recovered and broke above $490
🔹 Reached $565
🔹 And now pulled back to retest the $490–500 area
And this is where the chart gets interesting. 👀
🧩 The latest candle
The weekly candle has formed a doji around the $495 area, almost exactly where the previous breakout occurred.
That doesn't guarantee a reversal.
But after a pullback into a former resistance-turned-support zone, a doji can indicate that selling pressure is losing momentum and buyers are beginning to defend the level.
So I'm watching the next candle for confirmation.
🎯 Levels I'm watching
🟢 $490–500 — Key support / retest zone
If this area holds:
➡️ $565 — first resistance
➡️ $578 — major resistance
➡️ $700 — previous ATH / major target
And if price eventually clears the ATH with strength...
🚀 Discovery mode begins.
⚠️ What would invalidate the setup?
A sustained move back below the $490 area would weaken the bullish continuation thesis.
And a deeper break below $445 would be much more concerning, because that would mean the previous breakout/retest structure is failing.
🔥 The bigger picture
What I like here is the structure:
Breakout → Deep correction → Retest → Recovery → Breakout → Retest
That's exactly the kind of sequence I want to see in a healthy bullish continuation.
Now the question is:
Was $565 merely the first bounce... or the beginning of the next leg higher?
I'm watching $490–500 very closely.
Hold the retest → reclaim $565 → challenge $578 → ATH back in sight. 👀📈
Not a prediction. The levels are the confirmation points.
تم فتح الصفقة
Bounced from support, moving as expected, reaching the breakout level again.
📊 Charts → 🏗️ Structure → 🎯 Probability =📖 Chart Story
⏳ Patience → 🚀Success
🎯 If this setup makes sense to you, show it some support with a Boost.
⏳ Patience → 🚀Success
🎯 If this setup makes sense to you, show it some support with a Boost.
إخلاء المسؤولية
لا يُقصد بالمعلومات والمنشورات أن تكون، أو تشكل، أي نصيحة مالية أو استثمارية أو تجارية أو أنواع أخرى من النصائح أو التوصيات المقدمة أو المعتمدة من TradingView. اقرأ المزيد في شروط الاستخدام.
📊 Charts → 🏗️ Structure → 🎯 Probability =📖 Chart Story
⏳ Patience → 🚀Success
🎯 If this setup makes sense to you, show it some support with a Boost.
⏳ Patience → 🚀Success
🎯 If this setup makes sense to you, show it some support with a Boost.
إخلاء المسؤولية
لا يُقصد بالمعلومات والمنشورات أن تكون، أو تشكل، أي نصيحة مالية أو استثمارية أو تجارية أو أنواع أخرى من النصائح أو التوصيات المقدمة أو المعتمدة من TradingView. اقرأ المزيد في شروط الاستخدام.