
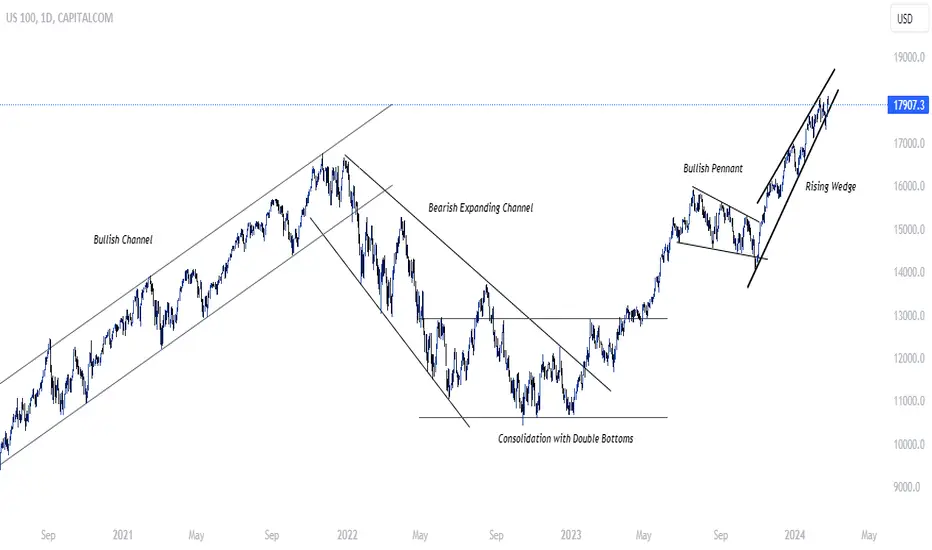
Since March 2020, the US100 index has shown a robust market structure. However, there's now the emergence of a rising wedge pattern under the daily timeframe, indicating a potential short to mid-term bearish trend. If a breakout occurs below the lower boundary of this rising wedge pattern, there's a possibility of a retracement or revisiting of the previous resistance level near $16500.

منشورات ذات صلة
إخلاء المسؤولية
لا يُقصد بالمعلومات والمنشورات أن تكون، أو تشكل، أي نصيحة مالية أو استثمارية أو تجارية أو أنواع أخرى من النصائح أو التوصيات المقدمة أو المعتمدة من TradingView. اقرأ المزيد في شروط الاستخدام.
منشورات ذات صلة
إخلاء المسؤولية
لا يُقصد بالمعلومات والمنشورات أن تكون، أو تشكل، أي نصيحة مالية أو استثمارية أو تجارية أو أنواع أخرى من النصائح أو التوصيات المقدمة أو المعتمدة من TradingView. اقرأ المزيد في شروط الاستخدام.