
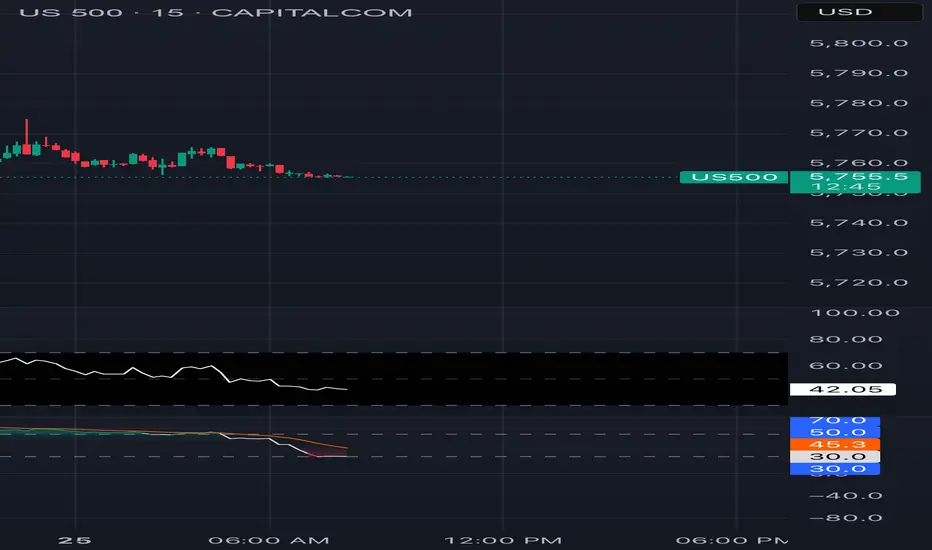
//version=5
indicator("NOVA ALGO", overlay = true)
// Get user input
nbuysell = input.bool(true, 'Buy/Sell Signal', inline = "BSNM",group='BUY/SELL SIGNAL')
nsensitivity = input.float(defval=2, title="-", inline = "BSNM", minval=1, maxval=20, group='BUY/SELL SIGNAL')
//candlecolor = input.bool(true, 'Buy/Sell Signal', inline = "BSNM",group='BUY/SELL SIGNAL')
// Trend Features
LongTrendAverage = input(true, 'Trend Cloud', group='TREND FEATURES')
TrendFollower = input(true, 'Trend Follower', group='TREND FEATURES')
ShowComulus = input(true, 'Comulus Cloud', group='TREND FEATURES')
CirrusCloud = input(true, 'Cirrus Cloud', group='TREND FEATURES')
enableReversal = input.bool(false, 'Dynamic TP 👁️ ', inline = 'overlayLine1', group = 'Settings')
// Risk Management
levels = input.bool(true, "Show TP/SL Levels" , group = "Risk Management" , inline = "MMDB2")
lvlLines = input.bool(true, "Show Lines ", inline="levels", group = "Risk Management")
linesStyle = input.string("SOLID", "", ["SOLID", "DASHED", "DOTTED"], inline="levels", group = "Risk Management")
lvlDistance = input.int(1, "Distance", 1, inline="levels2", group = "Risk Management")
lvlDecimals = input.int(2, " Decimals", 1, 8, inline="levels2", group = "Risk Management")
atrRisk = input.int(1, "Risk % ", 1, group = "Risk Management" , inline="levels3")
atrLen = input.int(14, " ATR Length", 1, group = "Risk Management" , inline="levels3")
decimals = lvlDecimals == 1 ? "#.#" : lvlDecimals == 2 ? "#.##" : lvlDecimals == 3 ? "#.###" : lvlDecimals == 4 ? "#.####" : lvlDecimals == 5 ? "#.#####" : lvlDecimals == 6 ? "#.######" : lvlDecimals == 7 ? "#.#######" : "#.########"
// Input settings
history_of_demand_to_keep = 20
show_zigzag = false
show_price_action_labels = false
showsr = input(true, title="Show Support & Resistance", group = 'Support & Resistance')
swing_length = input.int(defval=8, title="Sensitivity", group = 'Support & Resistance')
box_width = input.float(defval=4, title="Zone Width", group = 'Support & Resistance')
box_extend_option = input.string("Right", title="Extend Box", options=["Right", "Both"], group = 'Support & Resistance')
res = input.timeframe(title='Time Frame', defval='', group="Support & Resistance")
s1 = request.security(syminfo.tickerid, res, showsr, gaps=barmerge.gaps_on)
demand_color = input.color(color.rgb(0,188,212,70), title = 'Support & Resistance Color', group = 'Support & Resistance')
supply_color = input.color(color.rgb(178,40,51,70), title = '', group = 'Support & Resistance')
// Signal Generation
supertrend(_close, factor, atrLen) =>
atr = ta.atr(atrLen)
upperBand = _close + factor * atr
lowerBand = _close - factor * atr
prevLowerBand = nz(lowerBand[1])
prevUpperBand = nz(upperBand[1])
lowerBand := lowerBand > prevLowerBand or close[1] < prevLowerBand ? lowerBand : prevLowerBand
upperBand := upperBand < prevUpperBand or close[1] > prevUpperBand ? upperBand : prevUpperBand
int direction = na
float superTrend = na
prevSuperTrend = superTrend[1]
if na(atr[1])
direction := 1
else if prevSuperTrend == prevUpperBand
direction := close > upperBand ? -1 : 1
else
direction := close < lowerBand ? 1 : -1
superTrend := direction == -1 ? lowerBand : upperBand
[superTrend, direction]
// SMA
ocAvg = math.avg(open, close)
sma4 = ta.sma(close, 8)
sma5 = ta.sma(close, 9)
sma9 = ta.sma(close, 13)
psar = ta.sar(0.02, 0.02, 0.2)
//*in Easy Words Super Trend + SMA = Signals
[supertrend, direction] = supertrend(close, nsensitivity*2, 11)
source = close, period = 150
// Colors
green = #2BBC4D, green2 = #00DD00
red = #C51D0B, red2 = #DD0000
adxlen = 15
dilen = 15
dirmov(len) =>
up = ta.change(high)
down = -ta.change(low)
plusDM = na(up) ? na : up > down and up > 0 ? up : 0
minusDM = na(down) ? na : down > up and down > 0 ? down : 0
truerange = ta.rma(ta.tr, len)
plus = fixnan(100 * ta.rma(plusDM, len) / truerange)
minus = fixnan(100 * ta.rma(minusDM, len) / truerange)
[plus, minus]
adx(dilen, adxlen) =>
[plus, minus] = dirmov(dilen)
sum = plus + minus
adx = 100 * ta.rma(math.abs(plus - minus) / (sum == 0 ? 1 : sum), adxlen)
adx
sig = adx(dilen, adxlen)
// range ADX threshold
sidewaysThreshold = input.int(title='ADX Sideways Threshold (10-30)', minval=2, defval=15)
// boolean expression to see if the ADX is below tehe sideways threshold
bool isSideways = sig < sidewaysThreshold
// adding the option to color the bars when in a trading range
useBarColor = true
bColor = isSideways ? color.new(#4b148d, 0) : na
barcolor(useBarColor ? bColor : na)
barcolor(close > supertrend ? #00e2ff : #fe0100)
// High Lows
y1 = low - (ta.atr(30) * 2), y1B = low - ta.atr(30)
y2 = high + (ta.atr(30) * 2), y2B = high + ta.atr(30)
bull = ta.crossover(close, supertrend) and close >= sma9
bear = ta.crossunder(close, supertrend) and close <= sma9
// Plots
windowsize = 100
offset = 0.9
sigma = 6
//plot(ta.alma(source, windowsize, offset, sigma))
windowsize2 = 310
offset2 = 0.85
sigma2 = 32
//plot(ta.alma(source, windowsize2, offset2, sigma2))
// Chart Features
smoothrng(x, t, m) =>
wper = t * 2 - 1
avrng = ta.ema(math.abs(x - x[1]), t)
smoothrng = ta.ema(avrng, wper) * m
smoothrng
smrng = smoothrng(close, 22, 6)
rngfilt(x, r) =>
rngfilt = x
rngfilt := x > nz(rngfilt[1]) ? x - r < nz(rngfilt[1]) ? nz(rngfilt[1]) : x - r : x + r > nz(rngfilt[1]) ? nz(rngfilt[1]) : x + r
rngfilt
filt = rngfilt(close, smrng)
// ▒▒▒▒▒▒▒▒▒▒▒▒▒▒▒▒▒▒▒▒▒▒▒▒▒▒▒▒▒▒▒▒▒▒▒▒▒▒▒▒▒▒▒▒▒▒▒▒▒▒▒▒▒▒▒▒▒▒▒▒▒▒▒▒▒▒▒▒▒▒▒▒▒▒▒▒▒▒▒▒▒▒▒▒▒▒▒▒▒▒▒▒▒▒▒▒▒▒▒▒▒▒▒▒▒▒▒▒▒▒▒▒▒▒
upward = 0.0
upward := filt > filt[1] ? nz(upward[1]) + 1 : filt < filt[1] ? 0 : nz(upward[1])
downward = 0.0
downward := filt < filt[1] ? nz(downward[1]) + 1 : filt > filt[1] ? 0 : nz(downward[1])
filtcolor = upward > 0 ? color.new(#00e2ff, 50) : downward > 0 ? color.new(#fe0100, 50) : color.new(#56328f, 0)
plot(TrendFollower ? filt : na, color=filtcolor, linewidth=1, title='Trend Tracer')
// Trend Cloud
tclength = 600
hullma = ta.wma(2*ta.wma(close, tclength/2)-ta.wma(close, tclength), math.floor(math.sqrt(tclength)))
plot(LongTrendAverage ? hullma : na, 'Trend Cloud', linewidth=4, color=close[8] > hullma ? color.new(#00e2ff, 65) : color.new(#fe0100, 65))
// Comulus Cloud
candle = ta.alma(source, windowsize2, offset2, sigma2)
reach = ta.alma(source, windowsize, offset, sigma)
candlep = plot(ShowComulus ? candle : na, color=color.new(color.white, 100))
reachp = plot(ShowComulus ? reach : na, color=color.new(color.white, 100))
fill(reachp, candlep, color= candle > reach ? color.new(#fe0100, 85) : color.new(#00e2ff, 85))
// Chart Features
x1 = 22
x2 = 9
x3 = 15
x4 = 5
smoothrngX1(x, t, m) =>
wper = t * 2 - 1
avrng = ta.ema(math.abs(x - x[1]), t)
smoothrngX1 = ta.ema(avrng, wper) * m
smoothrngX1
smrngx1x = smoothrngX1(close, x1, x2)
smrngx1x2 = smoothrngX1(close, x3, x4)
rngfiltx1x1(x, r) =>
rngfiltx1x1 = x
rngfiltx1x1 := x > nz(rngfiltx1x1[1]) ? x - r < nz(rngfiltx1x1[1]) ? nz(rngfiltx1x1[1]) : x - r : x + r > nz(rngfiltx1x1[1]) ? nz(rngfiltx1x1[1]) : x + r
rngfiltx1x1
filtx1 = rngfiltx1x1(close, smrngx1x)
filtx12 = rngfiltx1x1(close, smrngx1x2)
// ▒▒▒▒▒▒▒▒▒▒▒▒▒▒▒▒▒▒▒▒▒▒▒▒▒▒▒▒▒▒▒▒▒▒▒▒▒▒▒▒▒▒▒▒▒▒▒▒▒▒▒▒▒▒▒▒▒▒▒▒▒▒▒▒▒▒▒▒▒▒▒▒▒▒▒▒▒▒▒▒▒▒▒▒▒▒▒▒▒▒▒▒▒▒▒▒▒▒▒▒▒▒▒▒▒▒▒▒▒▒▒▒▒▒
upwardx1 = 0.0
upwardx1 := filtx1 > filtx1[1] ? nz(upwardx1[1]) + 1 : filtx1 < filtx1[1] ? 0 : nz(upwardx1[1])
downwardx1 = 0.0
downwardx1 := filtx1 < filtx1[1] ? nz(downwardx1[1]) + 1 : filtx1 > filtx1[1] ? 0 : nz(downwardx1[1])
filtx1colorx1 = color.rgb(0, 187, 212, 100)
xxx1 = plot(CirrusCloud ? filtx1 : na, color=filtx1colorx1, linewidth=1, title='Trend Tracer', editable = false)
xxx2 = plot(CirrusCloud ? filtx12 : na, color=filtx1colorx1, linewidth=1, title='Trend Tracer', editable = false)
fill(xxx1, xxx2, color= filtx1 > filtx12 ? color.new(#fe0100, 65) : color.new(#00e2ff, 65))
buy = bull and nbuysell ? label.new(bar_index, y1, sma4 >= sma5 ? "Strong Buy" : "Buy", xloc.bar_index, yloc.price, #00e2ff, label.style_label_up, color.white, size.normal) : na
sell = bear and nbuysell ? label.new(bar_index, y2, sma4 <= sma5 ? "Strong Sell" : "Sell", xloc.bar_index, yloc.price, #fe0100, label.style_label_down, color.white, size.normal) : na
// Other initializations
avg_volume = ta.sma(volume, 20)
very_weak_multiplier = 0.5
weak_multiplier = 1
strong_multiplier = 1.5
// Rejection handling
var int[] demandRejections = array.new_int(history_of_demand_to_keep, 0)
var int[] supplyRejections = array.new_int(history_of_demand_to_keep, 0)
var int[] demandCreationBars = array.new_int(history_of_demand_to_keep, na)
var int[] supplyCreationBars = array.new_int(history_of_demand_to_keep, na)
var box[] current_demand_box = array.new_box(history_of_demand_to_keep, na)
var box[] current_supply_box = array.new_box(history_of_demand_to_keep, na)
f_check_demand_rejections() =>
for i = 0 to history_of_demand_to_keep - 1
if not na(array.get(demandCreationBars, i))
if bar_index - array.get(demandCreationBars, i) > 15 and bar_index - array.get(demandCreationBars, i) % 15 == 0
label.new(bar_index, high, "Checking demand rejection", color=color.red)
dBox = array.get(current_demand_box, i)
if (na(dBox))
continue
withinBox = (high >= box.get_bottom(dBox) and high <= box.get_top(dBox)) or (close >= box.get_bottom(dBox) and close <= box.get_top(dBox))
bearishCandlesCount = math.sum(close < open ? 1 : 0, 15)
if withinBox and bearishCandlesCount >= 7
label.new(bar_index, low, "Bearish count > 7", color=color.blue)
array.set(demandRejections, i, array.get(demandRejections, i) + 1)
f_check_supply_rejections() =>
for i = 0 to history_of_demand_to_keep - 1
if not na(array.get(supplyCreationBars, i))
if bar_index - array.get(supplyCreationBars, i) > 15 and bar_index - array.get(supplyCreationBars, i) % 15 == 0
label.new(bar_index, low, "Checking supply rejection", color=color.red)
sBox = array.get(current_supply_box, i)
if (na(sBox))
continue
withinBox = (low <= box.get_top(sBox) and low >= box.get_bottom(sBox)) or (close <= box.get_top(sBox) and close >= box.get_bottom(sBox))
bullishCandlesCount = math.sum(close > open ? 1 : 0, 15)
if withinBox and bullishCandlesCount >= 7
label.new(bar_index, high, "Bullish count > 7", color=color.blue)
array.set(supplyRejections, i, array.get(supplyRejections, i) + 1)
f_array_add_pop(array, new_value_to_add) =>
array.unshift(array, new_value_to_add)
array.pop(array)
f_sh_sl_labels(array, swing_type) =>
var string label_text = na
if swing_type == 1
if array.get(array, 0) >= array.get(array, 1)
label_text := 'HH'
else
label_text := 'LH'
label.new(bar_index - swing_length, array.get(array,0), text = label_text, style=label.style_label_down, textcolor = color.white, color = color.new(color.white, 100), size = size.tiny)
else if swing_type == -1
if array.get(array, 0) >= array.get(array, 1)
label_text := 'HL'
else
label_text := 'LL'
label.new(bar_index - swing_length, array.get(array,0), text = label_text, style=label.style_label_up, textcolor = color.white, color = color.new(color.white, 100), size = size.tiny)
f_check_overlapping(new_poi, box_array, atr) =>
atr_threshold = atr * 2
okay_to_draw = true
for i = 0 to array.size(box_array) - 1
top = box.get_top(array.get(box_array, i))
bottom = box.get_bottom(array.get(box_array, i))
poi = (top + bottom) / 2
upper_boundary = poi + atr_threshold
lower_boundary = poi - atr_threshold
if new_poi >= lower_boundary and new_poi <= upper_boundary
okay_to_draw := false
break
else
okay_to_draw := true
okay_to_draw
f_supply_demand(value_array, bn_array, box_array, label_array, box_type, atr) =>
atr_buffer = atr * (box_width / 10)
box_left = array.get(bn_array, 0)
box_right = bar_index + 20
var float box_top = 0.00
var float box_bottom = 0.00
var float poi = 0.00
if box_type == 1
box_top := array.get(value_array, 0)
box_bottom := box_top - atr_buffer
poi := (box_top + box_bottom) / 2
else if box_type == -1
box_bottom := array.get(value_array, 0)
box_top := box_bottom + atr_buffer
poi := (box_top + box_bottom) / 2
okay_to_draw = f_check_overlapping(poi, box_array, atr)
swing_volume = volume[swing_length]
var string strength_text = ""
highest_volume_last_20 = ta.highest(volume, 20)
volume_percentage = math.round(swing_volume / highest_volume_last_20 * 100)
volume_percentage := math.min(volume_percentage, 100) // Cap the volume percentage to 100
var extend_option = extend.right
if box_extend_option == "Right"
extend_option := extend.right
else if box_extend_option == "Both"
extend_option := extend.both
if box_type == 1 and okay_to_draw and s1
box.delete( array.get(box_array, array.size(box_array) - 5) )
f_array_add_pop(box_array, box.new( left = box_left, top = box_top, right = box_right, bottom = box_bottom, border_color = color.rgb(242,54,69,50), border_width=1,
bgcolor = supply_color, extend = extend_option, text = strength_text, text_halign = text.align_right, text_valign = text.align_center, text_color = color.white, text_size = size.small, xloc = xloc.bar_index))
box.delete( array.get(label_array, array.size(label_array) - 5) )
f_array_add_pop(label_array, box.new( left = box_left, top = poi, right = box_right, bottom = poi, border_color = color.rgb(242,54,69,50), border_width=1, border_style=line.style_dotted,
bgcolor = color.new(color.black,100), extend = extend_option, text = '', text_halign = text.align_left, text_valign = text.align_center, text_color = color.white, text_size = size.small, xloc = xloc.bar_index))
else if box_type == -1 and okay_to_draw and s1
box.delete( array.get(box_array, array.size(box_array) - 5) )
f_array_add_pop(box_array, box.new( left = box_left, top = box_top, right = box_right, bottom = box_bottom, border_color = color.rgb(0,188,212,50), border_width=1,
bgcolor = demand_color, extend = extend_option, text = strength_text, text_halign = text.align_right, text_valign = text.align_center, text_color = color.white, text_size = size.small, xloc = xloc.bar_index))
box.delete( array.get(label_array, array.size(label_array) - 5) )
f_array_add_pop(label_array, box.new( left = box_left, top = poi, right = box_right, bottom = poi, border_color = color.rgb(0,188,212,50), border_width=1, border_style=line.style_dotted,
bgcolor = color.new(color.black,100), extend = extend_option, text = '', text_halign = text.align_left, text_valign = text.align_center, text_color = color.white, text_size = size.small, xloc = xloc.bar_index))
f_sd_to_bos(box_array, bos_array, label_array, zone_type) =>
if zone_type == 1
for i = 0 to array.size(box_array) - 1
level_to_break = box.get_top(array.get(box_array,i))
if close >= level_to_break
box.delete(array.get(box_array, i))
box.delete(array.get(label_array, i))
if zone_type == -1
for i = 0 to array.size(box_array) - 1
level_to_break = box.get_bottom(array.get(box_array,i))
if close <= level_to_break
box.delete(array.get(box_array, i))
box.delete(array.get(label_array, i))
f_extend_box_endpoint(box_array) =>
for i = 0 to array.size(box_array) - 1
box.set_right(array.get(box_array, i), bar_index + 30) // Extend only 20 bars
atr567 = ta.atr(50)
swing_high = ta.pivothigh(high, swing_length, swing_length)
swing_low = ta.pivotlow(low, swing_length, swing_length)
var swing_high_values = array.new_float(5,0.00)
var swing_low_values = array.new_float(5,0.00)
var swing_high_bns = array.new_int(5,0)
var swing_low_bns = array.new_int(5,0)
var current_supply_poi = array.new_box(history_of_demand_to_keep, na)
var current_demand_poi = array.new_box(history_of_demand_to_keep, na)
var supply_bos = array.new_box(5, na)
var demand_bos = array.new_box(5, na)
if not na(swing_high)
f_array_add_pop(swing_high_values, swing_high)
f_array_add_pop(swing_high_bns, bar_index[swing_length])
if show_price_action_labels
f_sh_sl_labels(swing_high_values, 1)
f_supply_demand(swing_high_values, swing_high_bns, current_supply_box, current_supply_poi, 1, atr567)
else if not na(swing_low)
f_array_add_pop(swing_low_values, swing_low)
f_array_add_pop(swing_low_bns, bar_index[swing_length])
if show_price_action_labels
f_sh_sl_labels(swing_low_values, -1)
f_supply_demand(swing_low_values, swing_low_bns, current_demand_box, current_demand_poi, -1, atr567)
f_sd_to_bos(current_supply_box, supply_bos, current_supply_poi, 1)
f_sd_to_bos(current_demand_box, demand_bos, current_demand_poi, -1)
f_extend_box_endpoint(current_supply_box)
f_extend_box_endpoint(current_demand_box)
// Inside the main execution, after the box is drawn, check for rejections
if not na(swing_low)
f_array_add_pop(swing_low_values, swing_low)
f_array_add_pop(swing_low_bns, bar_index[swing_length])
if show_price_action_labels
f_sh_sl_labels(swing_low_values, -1)
f_supply_demand(swing_low_values, swing_low_bns, current_demand_box, current_demand_poi, -1, atr567)
f_check_demand_rejections()
if not na(swing_high)
f_array_add_pop(swing_high_values, swing_high)
f_array_add_pop(swing_high_bns, bar_index[swing_length])
if show_price_action_labels
f_sh_sl_labels(swing_high_values, 1)
f_supply_demand(swing_high_values, swing_high_bns, current_supply_box, current_supply_poi, 1, atr567)
f_check_supply_rejections()
trigger2 = bull ? 1 : 0
countBull = ta.barssince(bull)
countBear = ta.barssince(bear)
trigger = nz(countBull, bar_index) < nz(countBear, bar_index) ? 1 : 0
atrBand = ta.atr(atrLen) * atrRisk
atrStop = trigger == 1 ? low - atrBand : high + atrBand
lastTrade(close) => ta.valuewhen(bull or bear , close, 0)
entry = levels ? label.new(time, close, "ENTRY " + str.tostring(lastTrade(close), decimals), xloc.bar_time, yloc.price, #00e2ff, label.style_label_left, color.white, size.normal) : na
label.set_x(entry, label.get_x(entry) + math.round(ta.change(time) * lvlDistance))
label.set_y(entry, lastTrade(close))
label.delete(entry[1])
stop_y = lastTrade(atrStop)
stop = levels ? label.new(time, close, "SL " + str.tostring(stop_y, decimals), xloc.bar_time, yloc.price, red2, label.style_label_left, color.white, size.normal) : na
label.set_x(stop, label.get_x(stop) + math.round(ta.change(time) * lvlDistance))
label.set_y(stop, stop_y)
label.delete(stop[1])
tp1Rl_y = (lastTrade(close)-lastTrade(atrStop))*1 + lastTrade(close)
tp1Rl = levels ? label.new(time, close, "1:1 TP " + str.tostring(tp1Rl_y, decimals), xloc.bar_time, yloc.price, green2, label.style_label_left, color.white, size.normal ) : na
label.set_x(tp1Rl, label.get_x(tp1Rl) + math.round(ta.change(time) * lvlDistance))
label.set_y(tp1Rl, tp1Rl_y)
label.delete(tp1Rl[1])
tp2RL_y = (lastTrade(close)-lastTrade(atrStop))*2 + lastTrade(close)
tp2RL = levels ? label.new(time, close, "2:1 TP " + str.tostring(tp2RL_y, decimals), xloc.bar_time, yloc.price, green2, label.style_label_left, color.white, size.normal) : na
label.set_x(tp2RL, label.get_x(tp2RL) + math.round(ta.change(time) * lvlDistance))
label.set_y(tp2RL, tp2RL_y)
label.delete(tp2RL[1])
tp3RL_y = (lastTrade(close)-lastTrade(atrStop))*3 + lastTrade(close)
tp3RL = levels ? label.new(time, close, "3:1 TP " + str.tostring(tp3RL_y, decimals), xloc.bar_time, yloc.price, green2, label.style_label_left, color.white, size.normal) : na
label.set_x(tp3RL, label.get_x(tp3RL) + math.round(ta.change(time) * lvlDistance))
label.set_y(tp3RL, tp3RL_y)
label.delete(tp3RL[1])
style = linesStyle == "SOLID" ? line.style_solid : linesStyle == "DASHED" ? line.style_dashed : line.style_dotted
lineEntry = levels and lvlLines ? line.new(bar_index - (trigger == 0 ? countBull : countBear), lastTrade(close), bar_index + lvlDistance, lastTrade(close), xloc.bar_index, extend.none, #00e2ff, style, 2) : na, line.delete(lineEntry[1])
lineStop = levels and lvlLines ? line.new(bar_index - (trigger == 0 ? countBull : countBear), stop_y, bar_index + lvlDistance, stop_y, xloc.bar_index, extend.none, #fe0100, style, 2) : na, line.delete(lineStop[1])
lineTp1Rl = levels and lvlLines ? line.new(bar_index - (trigger == 0 ? countBull : countBear), tp1Rl_y, bar_index + lvlDistance, tp1Rl_y, xloc.bar_index, extend.none, green2, style, 2) : na, line.delete(lineTp1Rl[1])
lineTp2RL = levels and lvlLines ? line.new(bar_index - (trigger == 0 ? countBull : countBear), tp2RL_y, bar_index + lvlDistance, tp2RL_y, xloc.bar_index, extend.none, green2, style, 2) : na, line.delete(lineTp2RL[1])
lineTp3RL = levels and lvlLines ? line.new(bar_index - (trigger == 0 ? countBull : countBear), tp3RL_y, bar_index + lvlDistance, tp3RL_y, xloc.bar_index, extend.none, green2, style, 2) : na, line.delete(lineTp3RL[1])
alertcondition(bull, title='Buy Signal', message = "BUY")
alertcondition(bear, title='Buy Signal', message = "BUY")
//import protradingart/pta_plot/6 as pp
//pp.peakprofit(bull, bear)
indicator("NOVA ALGO", overlay = true)
// Get user input
nbuysell = input.bool(true, 'Buy/Sell Signal', inline = "BSNM",group='BUY/SELL SIGNAL')
nsensitivity = input.float(defval=2, title="-", inline = "BSNM", minval=1, maxval=20, group='BUY/SELL SIGNAL')
//candlecolor = input.bool(true, 'Buy/Sell Signal', inline = "BSNM",group='BUY/SELL SIGNAL')
// Trend Features
LongTrendAverage = input(true, 'Trend Cloud', group='TREND FEATURES')
TrendFollower = input(true, 'Trend Follower', group='TREND FEATURES')
ShowComulus = input(true, 'Comulus Cloud', group='TREND FEATURES')
CirrusCloud = input(true, 'Cirrus Cloud', group='TREND FEATURES')
enableReversal = input.bool(false, 'Dynamic TP 👁️ ', inline = 'overlayLine1', group = 'Settings')
// Risk Management
levels = input.bool(true, "Show TP/SL Levels" , group = "Risk Management" , inline = "MMDB2")
lvlLines = input.bool(true, "Show Lines ", inline="levels", group = "Risk Management")
linesStyle = input.string("SOLID", "", ["SOLID", "DASHED", "DOTTED"], inline="levels", group = "Risk Management")
lvlDistance = input.int(1, "Distance", 1, inline="levels2", group = "Risk Management")
lvlDecimals = input.int(2, " Decimals", 1, 8, inline="levels2", group = "Risk Management")
atrRisk = input.int(1, "Risk % ", 1, group = "Risk Management" , inline="levels3")
atrLen = input.int(14, " ATR Length", 1, group = "Risk Management" , inline="levels3")
decimals = lvlDecimals == 1 ? "#.#" : lvlDecimals == 2 ? "#.##" : lvlDecimals == 3 ? "#.###" : lvlDecimals == 4 ? "#.####" : lvlDecimals == 5 ? "#.#####" : lvlDecimals == 6 ? "#.######" : lvlDecimals == 7 ? "#.#######" : "#.########"
// Input settings
history_of_demand_to_keep = 20
show_zigzag = false
show_price_action_labels = false
showsr = input(true, title="Show Support & Resistance", group = 'Support & Resistance')
swing_length = input.int(defval=8, title="Sensitivity", group = 'Support & Resistance')
box_width = input.float(defval=4, title="Zone Width", group = 'Support & Resistance')
box_extend_option = input.string("Right", title="Extend Box", options=["Right", "Both"], group = 'Support & Resistance')
res = input.timeframe(title='Time Frame', defval='', group="Support & Resistance")
s1 = request.security(syminfo.tickerid, res, showsr, gaps=barmerge.gaps_on)
demand_color = input.color(color.rgb(0,188,212,70), title = 'Support & Resistance Color', group = 'Support & Resistance')
supply_color = input.color(color.rgb(178,40,51,70), title = '', group = 'Support & Resistance')
// Signal Generation
supertrend(_close, factor, atrLen) =>
atr = ta.atr(atrLen)
upperBand = _close + factor * atr
lowerBand = _close - factor * atr
prevLowerBand = nz(lowerBand[1])
prevUpperBand = nz(upperBand[1])
lowerBand := lowerBand > prevLowerBand or close[1] < prevLowerBand ? lowerBand : prevLowerBand
upperBand := upperBand < prevUpperBand or close[1] > prevUpperBand ? upperBand : prevUpperBand
int direction = na
float superTrend = na
prevSuperTrend = superTrend[1]
if na(atr[1])
direction := 1
else if prevSuperTrend == prevUpperBand
direction := close > upperBand ? -1 : 1
else
direction := close < lowerBand ? 1 : -1
superTrend := direction == -1 ? lowerBand : upperBand
[superTrend, direction]
// SMA
ocAvg = math.avg(open, close)
sma4 = ta.sma(close, 8)
sma5 = ta.sma(close, 9)
sma9 = ta.sma(close, 13)
psar = ta.sar(0.02, 0.02, 0.2)
//*in Easy Words Super Trend + SMA = Signals
[supertrend, direction] = supertrend(close, nsensitivity*2, 11)
source = close, period = 150
// Colors
green = #2BBC4D, green2 = #00DD00
red = #C51D0B, red2 = #DD0000
adxlen = 15
dilen = 15
dirmov(len) =>
up = ta.change(high)
down = -ta.change(low)
plusDM = na(up) ? na : up > down and up > 0 ? up : 0
minusDM = na(down) ? na : down > up and down > 0 ? down : 0
truerange = ta.rma(ta.tr, len)
plus = fixnan(100 * ta.rma(plusDM, len) / truerange)
minus = fixnan(100 * ta.rma(minusDM, len) / truerange)
[plus, minus]
adx(dilen, adxlen) =>
[plus, minus] = dirmov(dilen)
sum = plus + minus
adx = 100 * ta.rma(math.abs(plus - minus) / (sum == 0 ? 1 : sum), adxlen)
adx
sig = adx(dilen, adxlen)
// range ADX threshold
sidewaysThreshold = input.int(title='ADX Sideways Threshold (10-30)', minval=2, defval=15)
// boolean expression to see if the ADX is below tehe sideways threshold
bool isSideways = sig < sidewaysThreshold
// adding the option to color the bars when in a trading range
useBarColor = true
bColor = isSideways ? color.new(#4b148d, 0) : na
barcolor(useBarColor ? bColor : na)
barcolor(close > supertrend ? #00e2ff : #fe0100)
// High Lows
y1 = low - (ta.atr(30) * 2), y1B = low - ta.atr(30)
y2 = high + (ta.atr(30) * 2), y2B = high + ta.atr(30)
bull = ta.crossover(close, supertrend) and close >= sma9
bear = ta.crossunder(close, supertrend) and close <= sma9
// Plots
windowsize = 100
offset = 0.9
sigma = 6
//plot(ta.alma(source, windowsize, offset, sigma))
windowsize2 = 310
offset2 = 0.85
sigma2 = 32
//plot(ta.alma(source, windowsize2, offset2, sigma2))
// Chart Features
smoothrng(x, t, m) =>
wper = t * 2 - 1
avrng = ta.ema(math.abs(x - x[1]), t)
smoothrng = ta.ema(avrng, wper) * m
smoothrng
smrng = smoothrng(close, 22, 6)
rngfilt(x, r) =>
rngfilt = x
rngfilt := x > nz(rngfilt[1]) ? x - r < nz(rngfilt[1]) ? nz(rngfilt[1]) : x - r : x + r > nz(rngfilt[1]) ? nz(rngfilt[1]) : x + r
rngfilt
filt = rngfilt(close, smrng)
// ▒▒▒▒▒▒▒▒▒▒▒▒▒▒▒▒▒▒▒▒▒▒▒▒▒▒▒▒▒▒▒▒▒▒▒▒▒▒▒▒▒▒▒▒▒▒▒▒▒▒▒▒▒▒▒▒▒▒▒▒▒▒▒▒▒▒▒▒▒▒▒▒▒▒▒▒▒▒▒▒▒▒▒▒▒▒▒▒▒▒▒▒▒▒▒▒▒▒▒▒▒▒▒▒▒▒▒▒▒▒▒▒▒▒
upward = 0.0
upward := filt > filt[1] ? nz(upward[1]) + 1 : filt < filt[1] ? 0 : nz(upward[1])
downward = 0.0
downward := filt < filt[1] ? nz(downward[1]) + 1 : filt > filt[1] ? 0 : nz(downward[1])
filtcolor = upward > 0 ? color.new(#00e2ff, 50) : downward > 0 ? color.new(#fe0100, 50) : color.new(#56328f, 0)
plot(TrendFollower ? filt : na, color=filtcolor, linewidth=1, title='Trend Tracer')
// Trend Cloud
tclength = 600
hullma = ta.wma(2*ta.wma(close, tclength/2)-ta.wma(close, tclength), math.floor(math.sqrt(tclength)))
plot(LongTrendAverage ? hullma : na, 'Trend Cloud', linewidth=4, color=close[8] > hullma ? color.new(#00e2ff, 65) : color.new(#fe0100, 65))
// Comulus Cloud
candle = ta.alma(source, windowsize2, offset2, sigma2)
reach = ta.alma(source, windowsize, offset, sigma)
candlep = plot(ShowComulus ? candle : na, color=color.new(color.white, 100))
reachp = plot(ShowComulus ? reach : na, color=color.new(color.white, 100))
fill(reachp, candlep, color= candle > reach ? color.new(#fe0100, 85) : color.new(#00e2ff, 85))
// Chart Features
x1 = 22
x2 = 9
x3 = 15
x4 = 5
smoothrngX1(x, t, m) =>
wper = t * 2 - 1
avrng = ta.ema(math.abs(x - x[1]), t)
smoothrngX1 = ta.ema(avrng, wper) * m
smoothrngX1
smrngx1x = smoothrngX1(close, x1, x2)
smrngx1x2 = smoothrngX1(close, x3, x4)
rngfiltx1x1(x, r) =>
rngfiltx1x1 = x
rngfiltx1x1 := x > nz(rngfiltx1x1[1]) ? x - r < nz(rngfiltx1x1[1]) ? nz(rngfiltx1x1[1]) : x - r : x + r > nz(rngfiltx1x1[1]) ? nz(rngfiltx1x1[1]) : x + r
rngfiltx1x1
filtx1 = rngfiltx1x1(close, smrngx1x)
filtx12 = rngfiltx1x1(close, smrngx1x2)
// ▒▒▒▒▒▒▒▒▒▒▒▒▒▒▒▒▒▒▒▒▒▒▒▒▒▒▒▒▒▒▒▒▒▒▒▒▒▒▒▒▒▒▒▒▒▒▒▒▒▒▒▒▒▒▒▒▒▒▒▒▒▒▒▒▒▒▒▒▒▒▒▒▒▒▒▒▒▒▒▒▒▒▒▒▒▒▒▒▒▒▒▒▒▒▒▒▒▒▒▒▒▒▒▒▒▒▒▒▒▒▒▒▒▒
upwardx1 = 0.0
upwardx1 := filtx1 > filtx1[1] ? nz(upwardx1[1]) + 1 : filtx1 < filtx1[1] ? 0 : nz(upwardx1[1])
downwardx1 = 0.0
downwardx1 := filtx1 < filtx1[1] ? nz(downwardx1[1]) + 1 : filtx1 > filtx1[1] ? 0 : nz(downwardx1[1])
filtx1colorx1 = color.rgb(0, 187, 212, 100)
xxx1 = plot(CirrusCloud ? filtx1 : na, color=filtx1colorx1, linewidth=1, title='Trend Tracer', editable = false)
xxx2 = plot(CirrusCloud ? filtx12 : na, color=filtx1colorx1, linewidth=1, title='Trend Tracer', editable = false)
fill(xxx1, xxx2, color= filtx1 > filtx12 ? color.new(#fe0100, 65) : color.new(#00e2ff, 65))
buy = bull and nbuysell ? label.new(bar_index, y1, sma4 >= sma5 ? "Strong Buy" : "Buy", xloc.bar_index, yloc.price, #00e2ff, label.style_label_up, color.white, size.normal) : na
sell = bear and nbuysell ? label.new(bar_index, y2, sma4 <= sma5 ? "Strong Sell" : "Sell", xloc.bar_index, yloc.price, #fe0100, label.style_label_down, color.white, size.normal) : na
// Other initializations
avg_volume = ta.sma(volume, 20)
very_weak_multiplier = 0.5
weak_multiplier = 1
strong_multiplier = 1.5
// Rejection handling
var int[] demandRejections = array.new_int(history_of_demand_to_keep, 0)
var int[] supplyRejections = array.new_int(history_of_demand_to_keep, 0)
var int[] demandCreationBars = array.new_int(history_of_demand_to_keep, na)
var int[] supplyCreationBars = array.new_int(history_of_demand_to_keep, na)
var box[] current_demand_box = array.new_box(history_of_demand_to_keep, na)
var box[] current_supply_box = array.new_box(history_of_demand_to_keep, na)
f_check_demand_rejections() =>
for i = 0 to history_of_demand_to_keep - 1
if not na(array.get(demandCreationBars, i))
if bar_index - array.get(demandCreationBars, i) > 15 and bar_index - array.get(demandCreationBars, i) % 15 == 0
label.new(bar_index, high, "Checking demand rejection", color=color.red)
dBox = array.get(current_demand_box, i)
if (na(dBox))
continue
withinBox = (high >= box.get_bottom(dBox) and high <= box.get_top(dBox)) or (close >= box.get_bottom(dBox) and close <= box.get_top(dBox))
bearishCandlesCount = math.sum(close < open ? 1 : 0, 15)
if withinBox and bearishCandlesCount >= 7
label.new(bar_index, low, "Bearish count > 7", color=color.blue)
array.set(demandRejections, i, array.get(demandRejections, i) + 1)
f_check_supply_rejections() =>
for i = 0 to history_of_demand_to_keep - 1
if not na(array.get(supplyCreationBars, i))
if bar_index - array.get(supplyCreationBars, i) > 15 and bar_index - array.get(supplyCreationBars, i) % 15 == 0
label.new(bar_index, low, "Checking supply rejection", color=color.red)
sBox = array.get(current_supply_box, i)
if (na(sBox))
continue
withinBox = (low <= box.get_top(sBox) and low >= box.get_bottom(sBox)) or (close <= box.get_top(sBox) and close >= box.get_bottom(sBox))
bullishCandlesCount = math.sum(close > open ? 1 : 0, 15)
if withinBox and bullishCandlesCount >= 7
label.new(bar_index, high, "Bullish count > 7", color=color.blue)
array.set(supplyRejections, i, array.get(supplyRejections, i) + 1)
f_array_add_pop(array, new_value_to_add) =>
array.unshift(array, new_value_to_add)
array.pop(array)
f_sh_sl_labels(array, swing_type) =>
var string label_text = na
if swing_type == 1
if array.get(array, 0) >= array.get(array, 1)
label_text := 'HH'
else
label_text := 'LH'
label.new(bar_index - swing_length, array.get(array,0), text = label_text, style=label.style_label_down, textcolor = color.white, color = color.new(color.white, 100), size = size.tiny)
else if swing_type == -1
if array.get(array, 0) >= array.get(array, 1)
label_text := 'HL'
else
label_text := 'LL'
label.new(bar_index - swing_length, array.get(array,0), text = label_text, style=label.style_label_up, textcolor = color.white, color = color.new(color.white, 100), size = size.tiny)
f_check_overlapping(new_poi, box_array, atr) =>
atr_threshold = atr * 2
okay_to_draw = true
for i = 0 to array.size(box_array) - 1
top = box.get_top(array.get(box_array, i))
bottom = box.get_bottom(array.get(box_array, i))
poi = (top + bottom) / 2
upper_boundary = poi + atr_threshold
lower_boundary = poi - atr_threshold
if new_poi >= lower_boundary and new_poi <= upper_boundary
okay_to_draw := false
break
else
okay_to_draw := true
okay_to_draw
f_supply_demand(value_array, bn_array, box_array, label_array, box_type, atr) =>
atr_buffer = atr * (box_width / 10)
box_left = array.get(bn_array, 0)
box_right = bar_index + 20
var float box_top = 0.00
var float box_bottom = 0.00
var float poi = 0.00
if box_type == 1
box_top := array.get(value_array, 0)
box_bottom := box_top - atr_buffer
poi := (box_top + box_bottom) / 2
else if box_type == -1
box_bottom := array.get(value_array, 0)
box_top := box_bottom + atr_buffer
poi := (box_top + box_bottom) / 2
okay_to_draw = f_check_overlapping(poi, box_array, atr)
swing_volume = volume[swing_length]
var string strength_text = ""
highest_volume_last_20 = ta.highest(volume, 20)
volume_percentage = math.round(swing_volume / highest_volume_last_20 * 100)
volume_percentage := math.min(volume_percentage, 100) // Cap the volume percentage to 100
var extend_option = extend.right
if box_extend_option == "Right"
extend_option := extend.right
else if box_extend_option == "Both"
extend_option := extend.both
if box_type == 1 and okay_to_draw and s1
box.delete( array.get(box_array, array.size(box_array) - 5) )
f_array_add_pop(box_array, box.new( left = box_left, top = box_top, right = box_right, bottom = box_bottom, border_color = color.rgb(242,54,69,50), border_width=1,
bgcolor = supply_color, extend = extend_option, text = strength_text, text_halign = text.align_right, text_valign = text.align_center, text_color = color.white, text_size = size.small, xloc = xloc.bar_index))
box.delete( array.get(label_array, array.size(label_array) - 5) )
f_array_add_pop(label_array, box.new( left = box_left, top = poi, right = box_right, bottom = poi, border_color = color.rgb(242,54,69,50), border_width=1, border_style=line.style_dotted,
bgcolor = color.new(color.black,100), extend = extend_option, text = '', text_halign = text.align_left, text_valign = text.align_center, text_color = color.white, text_size = size.small, xloc = xloc.bar_index))
else if box_type == -1 and okay_to_draw and s1
box.delete( array.get(box_array, array.size(box_array) - 5) )
f_array_add_pop(box_array, box.new( left = box_left, top = box_top, right = box_right, bottom = box_bottom, border_color = color.rgb(0,188,212,50), border_width=1,
bgcolor = demand_color, extend = extend_option, text = strength_text, text_halign = text.align_right, text_valign = text.align_center, text_color = color.white, text_size = size.small, xloc = xloc.bar_index))
box.delete( array.get(label_array, array.size(label_array) - 5) )
f_array_add_pop(label_array, box.new( left = box_left, top = poi, right = box_right, bottom = poi, border_color = color.rgb(0,188,212,50), border_width=1, border_style=line.style_dotted,
bgcolor = color.new(color.black,100), extend = extend_option, text = '', text_halign = text.align_left, text_valign = text.align_center, text_color = color.white, text_size = size.small, xloc = xloc.bar_index))
f_sd_to_bos(box_array, bos_array, label_array, zone_type) =>
if zone_type == 1
for i = 0 to array.size(box_array) - 1
level_to_break = box.get_top(array.get(box_array,i))
if close >= level_to_break
box.delete(array.get(box_array, i))
box.delete(array.get(label_array, i))
if zone_type == -1
for i = 0 to array.size(box_array) - 1
level_to_break = box.get_bottom(array.get(box_array,i))
if close <= level_to_break
box.delete(array.get(box_array, i))
box.delete(array.get(label_array, i))
f_extend_box_endpoint(box_array) =>
for i = 0 to array.size(box_array) - 1
box.set_right(array.get(box_array, i), bar_index + 30) // Extend only 20 bars
atr567 = ta.atr(50)
swing_high = ta.pivothigh(high, swing_length, swing_length)
swing_low = ta.pivotlow(low, swing_length, swing_length)
var swing_high_values = array.new_float(5,0.00)
var swing_low_values = array.new_float(5,0.00)
var swing_high_bns = array.new_int(5,0)
var swing_low_bns = array.new_int(5,0)
var current_supply_poi = array.new_box(history_of_demand_to_keep, na)
var current_demand_poi = array.new_box(history_of_demand_to_keep, na)
var supply_bos = array.new_box(5, na)
var demand_bos = array.new_box(5, na)
if not na(swing_high)
f_array_add_pop(swing_high_values, swing_high)
f_array_add_pop(swing_high_bns, bar_index[swing_length])
if show_price_action_labels
f_sh_sl_labels(swing_high_values, 1)
f_supply_demand(swing_high_values, swing_high_bns, current_supply_box, current_supply_poi, 1, atr567)
else if not na(swing_low)
f_array_add_pop(swing_low_values, swing_low)
f_array_add_pop(swing_low_bns, bar_index[swing_length])
if show_price_action_labels
f_sh_sl_labels(swing_low_values, -1)
f_supply_demand(swing_low_values, swing_low_bns, current_demand_box, current_demand_poi, -1, atr567)
f_sd_to_bos(current_supply_box, supply_bos, current_supply_poi, 1)
f_sd_to_bos(current_demand_box, demand_bos, current_demand_poi, -1)
f_extend_box_endpoint(current_supply_box)
f_extend_box_endpoint(current_demand_box)
// Inside the main execution, after the box is drawn, check for rejections
if not na(swing_low)
f_array_add_pop(swing_low_values, swing_low)
f_array_add_pop(swing_low_bns, bar_index[swing_length])
if show_price_action_labels
f_sh_sl_labels(swing_low_values, -1)
f_supply_demand(swing_low_values, swing_low_bns, current_demand_box, current_demand_poi, -1, atr567)
f_check_demand_rejections()
if not na(swing_high)
f_array_add_pop(swing_high_values, swing_high)
f_array_add_pop(swing_high_bns, bar_index[swing_length])
if show_price_action_labels
f_sh_sl_labels(swing_high_values, 1)
f_supply_demand(swing_high_values, swing_high_bns, current_supply_box, current_supply_poi, 1, atr567)
f_check_supply_rejections()
trigger2 = bull ? 1 : 0
countBull = ta.barssince(bull)
countBear = ta.barssince(bear)
trigger = nz(countBull, bar_index) < nz(countBear, bar_index) ? 1 : 0
atrBand = ta.atr(atrLen) * atrRisk
atrStop = trigger == 1 ? low - atrBand : high + atrBand
lastTrade(close) => ta.valuewhen(bull or bear , close, 0)
entry = levels ? label.new(time, close, "ENTRY " + str.tostring(lastTrade(close), decimals), xloc.bar_time, yloc.price, #00e2ff, label.style_label_left, color.white, size.normal) : na
label.set_x(entry, label.get_x(entry) + math.round(ta.change(time) * lvlDistance))
label.set_y(entry, lastTrade(close))
label.delete(entry[1])
stop_y = lastTrade(atrStop)
stop = levels ? label.new(time, close, "SL " + str.tostring(stop_y, decimals), xloc.bar_time, yloc.price, red2, label.style_label_left, color.white, size.normal) : na
label.set_x(stop, label.get_x(stop) + math.round(ta.change(time) * lvlDistance))
label.set_y(stop, stop_y)
label.delete(stop[1])
tp1Rl_y = (lastTrade(close)-lastTrade(atrStop))*1 + lastTrade(close)
tp1Rl = levels ? label.new(time, close, "1:1 TP " + str.tostring(tp1Rl_y, decimals), xloc.bar_time, yloc.price, green2, label.style_label_left, color.white, size.normal ) : na
label.set_x(tp1Rl, label.get_x(tp1Rl) + math.round(ta.change(time) * lvlDistance))
label.set_y(tp1Rl, tp1Rl_y)
label.delete(tp1Rl[1])
tp2RL_y = (lastTrade(close)-lastTrade(atrStop))*2 + lastTrade(close)
tp2RL = levels ? label.new(time, close, "2:1 TP " + str.tostring(tp2RL_y, decimals), xloc.bar_time, yloc.price, green2, label.style_label_left, color.white, size.normal) : na
label.set_x(tp2RL, label.get_x(tp2RL) + math.round(ta.change(time) * lvlDistance))
label.set_y(tp2RL, tp2RL_y)
label.delete(tp2RL[1])
tp3RL_y = (lastTrade(close)-lastTrade(atrStop))*3 + lastTrade(close)
tp3RL = levels ? label.new(time, close, "3:1 TP " + str.tostring(tp3RL_y, decimals), xloc.bar_time, yloc.price, green2, label.style_label_left, color.white, size.normal) : na
label.set_x(tp3RL, label.get_x(tp3RL) + math.round(ta.change(time) * lvlDistance))
label.set_y(tp3RL, tp3RL_y)
label.delete(tp3RL[1])
style = linesStyle == "SOLID" ? line.style_solid : linesStyle == "DASHED" ? line.style_dashed : line.style_dotted
lineEntry = levels and lvlLines ? line.new(bar_index - (trigger == 0 ? countBull : countBear), lastTrade(close), bar_index + lvlDistance, lastTrade(close), xloc.bar_index, extend.none, #00e2ff, style, 2) : na, line.delete(lineEntry[1])
lineStop = levels and lvlLines ? line.new(bar_index - (trigger == 0 ? countBull : countBear), stop_y, bar_index + lvlDistance, stop_y, xloc.bar_index, extend.none, #fe0100, style, 2) : na, line.delete(lineStop[1])
lineTp1Rl = levels and lvlLines ? line.new(bar_index - (trigger == 0 ? countBull : countBear), tp1Rl_y, bar_index + lvlDistance, tp1Rl_y, xloc.bar_index, extend.none, green2, style, 2) : na, line.delete(lineTp1Rl[1])
lineTp2RL = levels and lvlLines ? line.new(bar_index - (trigger == 0 ? countBull : countBear), tp2RL_y, bar_index + lvlDistance, tp2RL_y, xloc.bar_index, extend.none, green2, style, 2) : na, line.delete(lineTp2RL[1])
lineTp3RL = levels and lvlLines ? line.new(bar_index - (trigger == 0 ? countBull : countBear), tp3RL_y, bar_index + lvlDistance, tp3RL_y, xloc.bar_index, extend.none, green2, style, 2) : na, line.delete(lineTp3RL[1])
alertcondition(bull, title='Buy Signal', message = "BUY")
alertcondition(bear, title='Buy Signal', message = "BUY")
//import protradingart/pta_plot/6 as pp
//pp.peakprofit(bull, bear)

إخلاء المسؤولية
لا يُقصد بالمعلومات والمنشورات أن تكون، أو تشكل، أي نصيحة مالية أو استثمارية أو تجارية أو أنواع أخرى من النصائح أو التوصيات المقدمة أو المعتمدة من TradingView. اقرأ المزيد في شروط الاستخدام.
إخلاء المسؤولية
لا يُقصد بالمعلومات والمنشورات أن تكون، أو تشكل، أي نصيحة مالية أو استثمارية أو تجارية أو أنواع أخرى من النصائح أو التوصيات المقدمة أو المعتمدة من TradingView. اقرأ المزيد في شروط الاستخدام.