
US500: Trend Shift - Potential Break of Key Support Levels
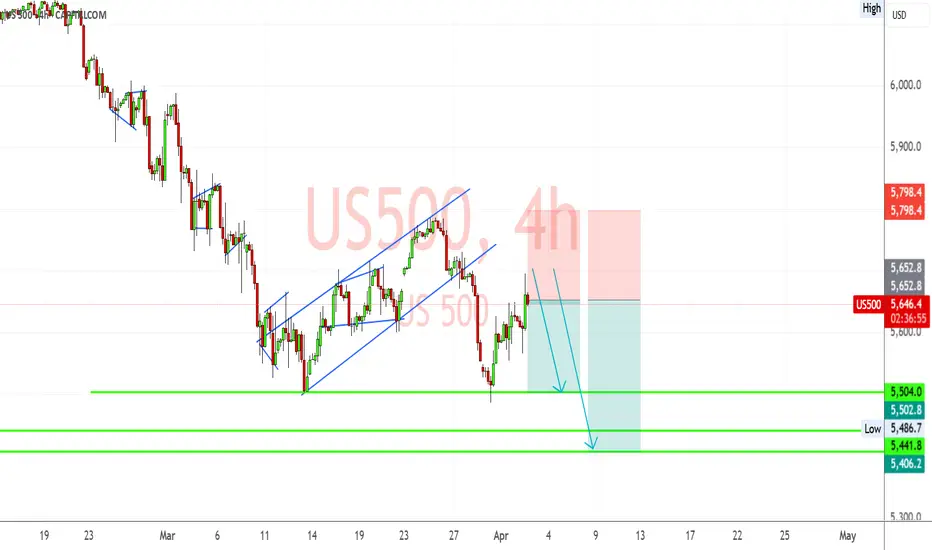
This analysis focuses on the US500 chart, a representation of the S&P 500 index, a key indicator of the US stock market's performance. The chart displays price action over a 4-hour timeframe, offering a medium-term perspective. The analysis aims to identify potential support levels and assess the likelihood of further bearish movement.
2. Key Findings and Supporting Evidence:
Bearish Trend: The chart clearly shows a prevailing downtrend. The price has been making lower highs and lower lows, signifying strong selling pressure.
Breakdown of Rising Wedge: A rising wedge pattern, often considered a bearish reversal pattern, is visible between March 11th and March 27th. The subsequent breakdown from this wedge has confirmed the bearish sentiment and suggests a continuation of the downtrend.
Potential Support Levels: The chart highlights three potential support levels:
5500 (Current Level): The price is currently hovering around this level. A break below this level could trigger further selling.
5504.2 (First Target): This level is marked as the first potential target for the bearish move.
5441.3 (Second Target): This level represents a more significant support and a deeper potential target.
Trading Strategy Indication: The chart suggests a potential short-selling opportunity, with entry around the current level (5500) and targets at the identified support levels. The stop-loss is placed above the recent high to manage risk.
High Volatility: The sharp price swings and the length of the red (bearish) candles indicate high volatility, suggesting strong momentum behind the downtrend.
3. Relevant Data and Statistics (Inferred):
Timeframe: 4-hour chart.
Index: US500 (S&P 500 equivalent).
Recent High: Approximately 5800.
Recent Low: Approximately 5486.7.
Potential Support Levels: 5500, 5504.2, 5441.3.
4. Discussion of Implications and Potential Future Trends:
Market Sentiment: The breakdown from the rising wedge and the continued bearish momentum suggest a shift in market sentiment towards increased pessimism.
Economic Factors: The downtrend could be influenced by various economic factors, such as rising interest rates, inflation concerns, or geopolitical uncertainties.
Risk Management: Traders should exercise caution and implement proper risk management strategies, including stop-loss orders, due to the high volatility.
Potential for Rebound: While the current trend is bearish, it's essential to acknowledge the possibility of a rebound or consolidation at the support levels.
2. Key Findings and Supporting Evidence:
Bearish Trend: The chart clearly shows a prevailing downtrend. The price has been making lower highs and lower lows, signifying strong selling pressure.
Breakdown of Rising Wedge: A rising wedge pattern, often considered a bearish reversal pattern, is visible between March 11th and March 27th. The subsequent breakdown from this wedge has confirmed the bearish sentiment and suggests a continuation of the downtrend.
Potential Support Levels: The chart highlights three potential support levels:
5500 (Current Level): The price is currently hovering around this level. A break below this level could trigger further selling.
5504.2 (First Target): This level is marked as the first potential target for the bearish move.
5441.3 (Second Target): This level represents a more significant support and a deeper potential target.
Trading Strategy Indication: The chart suggests a potential short-selling opportunity, with entry around the current level (5500) and targets at the identified support levels. The stop-loss is placed above the recent high to manage risk.
High Volatility: The sharp price swings and the length of the red (bearish) candles indicate high volatility, suggesting strong momentum behind the downtrend.
3. Relevant Data and Statistics (Inferred):
Timeframe: 4-hour chart.
Index: US500 (S&P 500 equivalent).
Recent High: Approximately 5800.
Recent Low: Approximately 5486.7.
Potential Support Levels: 5500, 5504.2, 5441.3.
4. Discussion of Implications and Potential Future Trends:
Market Sentiment: The breakdown from the rising wedge and the continued bearish momentum suggest a shift in market sentiment towards increased pessimism.
Economic Factors: The downtrend could be influenced by various economic factors, such as rising interest rates, inflation concerns, or geopolitical uncertainties.
Risk Management: Traders should exercise caution and implement proper risk management strategies, including stop-loss orders, due to the high volatility.
Potential for Rebound: While the current trend is bearish, it's essential to acknowledge the possibility of a rebound or consolidation at the support levels.
أغلقت الصفقة: تم الوصول للهدف
Another day, another successful US500 trade. Our private channel just secured +240 pips. 
📊 Forex Signals | Free Daily Alerts
✅ 85% Accuracy | 1–2 Signals/Day
💰 Profitable Trades Sent Daily – No Cost
📲 Join Us on Telegram
t.me/ultreos_forex
🎯 Upgrade to VIP:
ultreosforex.com/
✅ 85% Accuracy | 1–2 Signals/Day
💰 Profitable Trades Sent Daily – No Cost
📲 Join Us on Telegram
t.me/ultreos_forex
🎯 Upgrade to VIP:
ultreosforex.com/
إخلاء المسؤولية
لا يُقصد بالمعلومات والمنشورات أن تكون، أو تشكل، أي نصيحة مالية أو استثمارية أو تجارية أو أنواع أخرى من النصائح أو التوصيات المقدمة أو المعتمدة من TradingView. اقرأ المزيد في شروط الاستخدام.
📊 Forex Signals | Free Daily Alerts
✅ 85% Accuracy | 1–2 Signals/Day
💰 Profitable Trades Sent Daily – No Cost
📲 Join Us on Telegram
t.me/ultreos_forex
🎯 Upgrade to VIP:
ultreosforex.com/
✅ 85% Accuracy | 1–2 Signals/Day
💰 Profitable Trades Sent Daily – No Cost
📲 Join Us on Telegram
t.me/ultreos_forex
🎯 Upgrade to VIP:
ultreosforex.com/
إخلاء المسؤولية
لا يُقصد بالمعلومات والمنشورات أن تكون، أو تشكل، أي نصيحة مالية أو استثمارية أو تجارية أو أنواع أخرى من النصائح أو التوصيات المقدمة أو المعتمدة من TradingView. اقرأ المزيد في شروط الاستخدام.