Hey Realistic Traders, Will  US500 Move beyond 6,200? Let’s dive into the analysis...
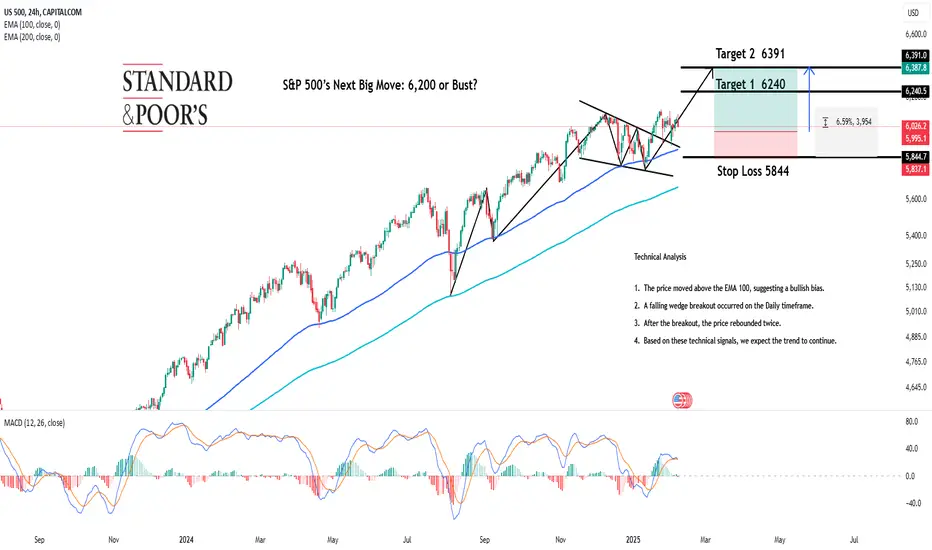
On the daily chart, the S&P 500 is trading above both the EMA-100 and EMA-200, confirming a robust bullish trend. This momentum was reinforced by a falling wedge breakout, a pattern that typically signals the continuation of bullish pressure. Additionally, the price tested the upper trendline twice and bounced off each time, further underlining the strength of the upward move.
Considering these strong technical signals, the price is likely to move downward toward the first target at 6.240 or potentially the second target at 6.391.
However, this bullish scenario depends on the price staying below the critical stop-loss level at 5844
Support the channel by engaging with the content, using the rocket button, and sharing your opinions in the comments below.
Disclaimer: “Please note that this analysis is solely for educational purposes and should not be considered a recommendation to take a long or short position on S&P500”.
US500 Move beyond 6,200? Let’s dive into the analysis...On the daily chart, the S&P 500 is trading above both the EMA-100 and EMA-200, confirming a robust bullish trend. This momentum was reinforced by a falling wedge breakout, a pattern that typically signals the continuation of bullish pressure. Additionally, the price tested the upper trendline twice and bounced off each time, further underlining the strength of the upward move.
Considering these strong technical signals, the price is likely to move downward toward the first target at 6.240 or potentially the second target at 6.391.
However, this bullish scenario depends on the price staying below the critical stop-loss level at 5844
Support the channel by engaging with the content, using the rocket button, and sharing your opinions in the comments below.
Disclaimer: “Please note that this analysis is solely for educational purposes and should not be considered a recommendation to take a long or short position on S&P500”.
ملاحظة
Revision: "Considering these strong technical signals, the price is likely to move downward toward the first target at 6.240 or potentially the second target at 6.391" into "Considering these strong technical signals, the price is likely to move upward toward the first target at 6.240 or potentially the second target at 6.391".تم فتح الصفقة
it still makes the consolidation phase on the H4 timeframe, but keeps moving above the EMA-200 line. It usually a sign of a bullish trend
منشورات ذات صلة
إخلاء المسؤولية
لا يُقصد بالمعلومات والمنشورات أن تكون، أو تشكل، أي نصيحة مالية أو استثمارية أو تجارية أو أنواع أخرى من النصائح أو التوصيات المقدمة أو المعتمدة من TradingView. اقرأ المزيد في شروط الاستخدام.
منشورات ذات صلة
إخلاء المسؤولية
لا يُقصد بالمعلومات والمنشورات أن تكون، أو تشكل، أي نصيحة مالية أو استثمارية أو تجارية أو أنواع أخرى من النصائح أو التوصيات المقدمة أو المعتمدة من TradingView. اقرأ المزيد في شروط الاستخدام.