
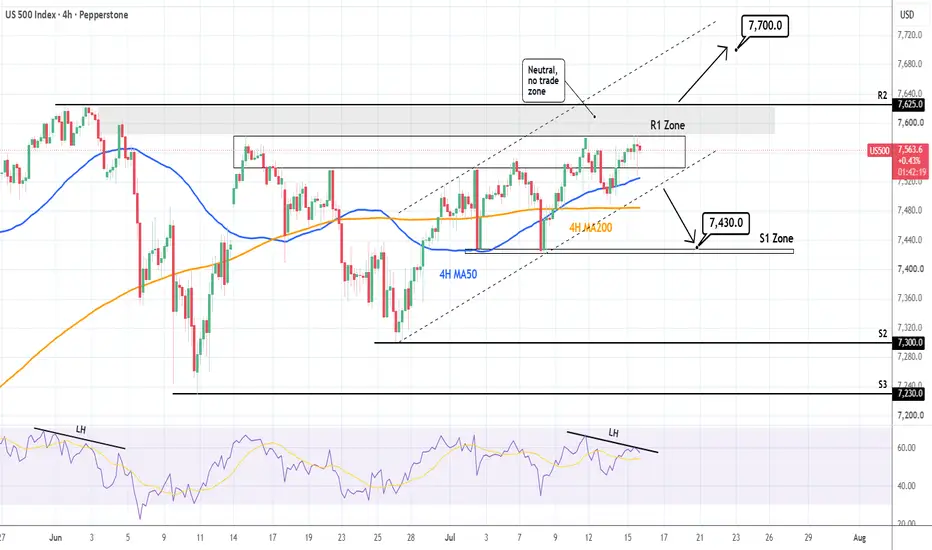
S&P500 marginally turned bullish on its 1D technical outlook (RSI = 57.957, MACD = 31.350, ADX = 21.540) as it's been on a strong rise since yesterday that hit today the top of the R1 Zone. This is the region where all corrections of the past 30 days were initiated. Since however we are on Higher Lows since June 26th, we may be potentially witnessing the emergence of a Channel Up but it is confirmed only if the R1 Zone and R2 break. Above the R2, buy and TP = 7,700. Below the bottom of the Channel Up, target the S1 Zone (TP = 7,430). Observe the LH on the 4H RSI, similar to the June peak.
## If you like our free content follow our profile to get more daily ideas. ##
## Comments and likes are greatly appreciated. ##
## If you like our free content follow our profile to get more daily ideas. ##
## Comments and likes are greatly appreciated. ##

I trade Crypto, Forex, Indices & Commodities all from one account on PrimeXBT with TradingView charts
Register here👉 investingscope.s.gy/PrimeXBT
Contact me for Account Management (+15% monthly profit)
Telegram👉 t.me/investingscope
Register here👉 investingscope.s.gy/PrimeXBT
Contact me for Account Management (+15% monthly profit)
Telegram👉 t.me/investingscope
إخلاء المسؤولية
لا يُقصد بالمعلومات والمنشورات أن تكون، أو تشكل، أي نصيحة مالية أو استثمارية أو تجارية أو أنواع أخرى من النصائح أو التوصيات المقدمة أو المعتمدة من TradingView. اقرأ المزيد في شروط الاستخدام.
I trade Crypto, Forex, Indices & Commodities all from one account on PrimeXBT with TradingView charts
Register here👉 investingscope.s.gy/PrimeXBT
Contact me for Account Management (+15% monthly profit)
Telegram👉 t.me/investingscope
Register here👉 investingscope.s.gy/PrimeXBT
Contact me for Account Management (+15% monthly profit)
Telegram👉 t.me/investingscope
إخلاء المسؤولية
لا يُقصد بالمعلومات والمنشورات أن تكون، أو تشكل، أي نصيحة مالية أو استثمارية أو تجارية أو أنواع أخرى من النصائح أو التوصيات المقدمة أو المعتمدة من TradingView. اقرأ المزيد في شروط الاستخدام.