
2026 ATH Rally? PMI and US Net Liquidity + M2 / US Debt
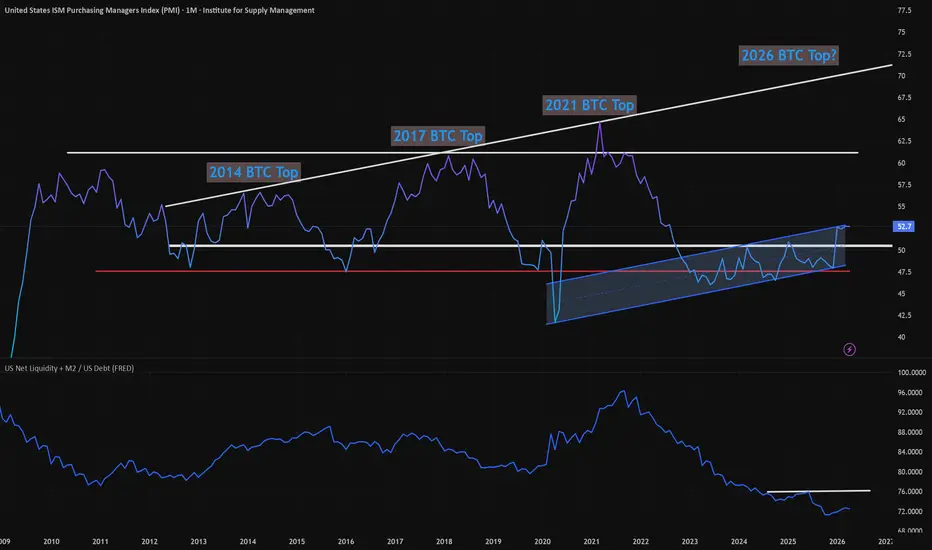
In this study, we analyze the ISM Purchasing Managers Index which while in an uptrending parallel channel of sorts, it also shows that the 2025 'Bull Run' never got close to projected 'top' levels.
Almost as if we never had the 2025 bull market top rally. Could it just be DELAYED?
While The ISM Manufacturing PMI is holding above the critical 50 threshold indicates continued economic expansion, which historically correlates with risk-on sentiment in crypto markets.
At 52.7 (+0.57%), we're seeing steady manufacturing growth that could support Bitcoin's current consolidation phase around $79,400, but NOT a rip-roaring market rally to new ATH.
Also, we can see from the US Net Liquidity + M2 / US Debt chart (lower frame) that we also didn't get the correlating rise in liquidity we usually see while building a new ATH on Bitcoin.
In fact, the prior floor for this back in 2011, now seems to be acting as resistance, rejecting in mid-2025. This points to a weak economic picture, and we'd need to see this ratio improve.
Either by dramatically lowering our close to $40T in debt (not likely anytime soon) and/OR seeing the 'Money Printer Go Brrrr' again, with post Covid-like stimulus and ideally lower interest rates and inflation. (I'm not a Macro guy, so don't beat me up here if I'm off a bit).
Either way, this chart tells the 'hidden story' of why we didn't see the massive pump to $150k - $200k Bitcoin in the last Bull Run...
But with improving economic and regulatory conditions... Could we?
For example, if / when the following tailwinds pick up:
- Final approval and signing of the Clarity Act into Law
- Easing of Middle-East tensions and an end to the Iran war
- New Fed-Chief approval and at least signaling lower rates later in 2026
- Fed QE and money printing to stimluate the economy
- ETF inflows continuing to increase and Strategy strong buying
- Potentially 're-valuing' Gold to current prices and selling enough to lower the US Debt
We could get our 2nd phase of the bull-cycle into 2026-2027.
I'd also like to point out that typically the cycle lows don't fully resolve and turn higher until 13 months after the previous highs, which points toward the Sept / October 2026 time-frame.
Cycle theory also points to this time-frame for the 4-year cycle lows to be in.
Key observations from this analysis:
- PMI above 50 typically supports risk asset rallies
- Current reading suggests economic stability vs recession fears
- Manufacturing strength often precedes crypto institutional inflows
- Historical correlation shows BTC tends to rally 2-4 weeks after sustained PMI strength
- Improved economic conditions per above could turn things around by Sept / Oct 2026
Scenarios:
Bullish Case: Sustained PMI above 52 could drive BTC toward $85k-$90k resistance
Bearish Case: PMI reversal below 50 would likely accelerate the correction to $70k support
This economic backdrop, combined with my previous technical analysis showing potential 50% corrections, creates an interesting divergence worth monitoring closely.
The next PMI release on June 1st will be critical for confirming this trend.
What's your take on how economic indicators should factor into crypto analysis?
Drop your thoughts below.
Almost as if we never had the 2025 bull market top rally. Could it just be DELAYED?
While The ISM Manufacturing PMI is holding above the critical 50 threshold indicates continued economic expansion, which historically correlates with risk-on sentiment in crypto markets.
At 52.7 (+0.57%), we're seeing steady manufacturing growth that could support Bitcoin's current consolidation phase around $79,400, but NOT a rip-roaring market rally to new ATH.
Also, we can see from the US Net Liquidity + M2 / US Debt chart (lower frame) that we also didn't get the correlating rise in liquidity we usually see while building a new ATH on Bitcoin.
In fact, the prior floor for this back in 2011, now seems to be acting as resistance, rejecting in mid-2025. This points to a weak economic picture, and we'd need to see this ratio improve.
Either by dramatically lowering our close to $40T in debt (not likely anytime soon) and/OR seeing the 'Money Printer Go Brrrr' again, with post Covid-like stimulus and ideally lower interest rates and inflation. (I'm not a Macro guy, so don't beat me up here if I'm off a bit).
Either way, this chart tells the 'hidden story' of why we didn't see the massive pump to $150k - $200k Bitcoin in the last Bull Run...
But with improving economic and regulatory conditions... Could we?
For example, if / when the following tailwinds pick up:
- Final approval and signing of the Clarity Act into Law
- Easing of Middle-East tensions and an end to the Iran war
- New Fed-Chief approval and at least signaling lower rates later in 2026
- Fed QE and money printing to stimluate the economy
- ETF inflows continuing to increase and Strategy strong buying
- Potentially 're-valuing' Gold to current prices and selling enough to lower the US Debt
We could get our 2nd phase of the bull-cycle into 2026-2027.
I'd also like to point out that typically the cycle lows don't fully resolve and turn higher until 13 months after the previous highs, which points toward the Sept / October 2026 time-frame.
Cycle theory also points to this time-frame for the 4-year cycle lows to be in.
Key observations from this analysis:
- PMI above 50 typically supports risk asset rallies
- Current reading suggests economic stability vs recession fears
- Manufacturing strength often precedes crypto institutional inflows
- Historical correlation shows BTC tends to rally 2-4 weeks after sustained PMI strength
- Improved economic conditions per above could turn things around by Sept / Oct 2026
Scenarios:
Bullish Case: Sustained PMI above 52 could drive BTC toward $85k-$90k resistance
Bearish Case: PMI reversal below 50 would likely accelerate the correction to $70k support
This economic backdrop, combined with my previous technical analysis showing potential 50% corrections, creates an interesting divergence worth monitoring closely.
The next PMI release on June 1st will be critical for confirming this trend.
What's your take on how economic indicators should factor into crypto analysis?
Drop your thoughts below.
تم فتح الصفقة
Finally seeing signs of life on the ISM PMI with new economic data out showing the economy is doing better than expected. I maintain that we NEVER had THE Bull Run and once this gets going, with the M2 + Liquidity coming back into the system, we'll push off to new highs possibly in 2027!ملاحظة
#PMI #ISM #M2
25-year investor & trader, bought 1st BTC at $20
More information:
Work With Me 1:1
moonstreamcoaching.com
Trading Signals: CryptoMastery.org
M3 Active Trader: Moonstream.io/M3
More information:
Work With Me 1:1
moonstreamcoaching.com
Trading Signals: CryptoMastery.org
M3 Active Trader: Moonstream.io/M3
إخلاء المسؤولية
لا يُقصد بالمعلومات والمنشورات أن تكون، أو تشكل، أي نصيحة مالية أو استثمارية أو تجارية أو أنواع أخرى من النصائح أو التوصيات المقدمة أو المعتمدة من TradingView. اقرأ المزيد في شروط الاستخدام.
25-year investor & trader, bought 1st BTC at $20
More information:
Work With Me 1:1
moonstreamcoaching.com
Trading Signals: CryptoMastery.org
M3 Active Trader: Moonstream.io/M3
More information:
Work With Me 1:1
moonstreamcoaching.com
Trading Signals: CryptoMastery.org
M3 Active Trader: Moonstream.io/M3
إخلاء المسؤولية
لا يُقصد بالمعلومات والمنشورات أن تكون، أو تشكل، أي نصيحة مالية أو استثمارية أو تجارية أو أنواع أخرى من النصائح أو التوصيات المقدمة أو المعتمدة من TradingView. اقرأ المزيد في شروط الاستخدام.