

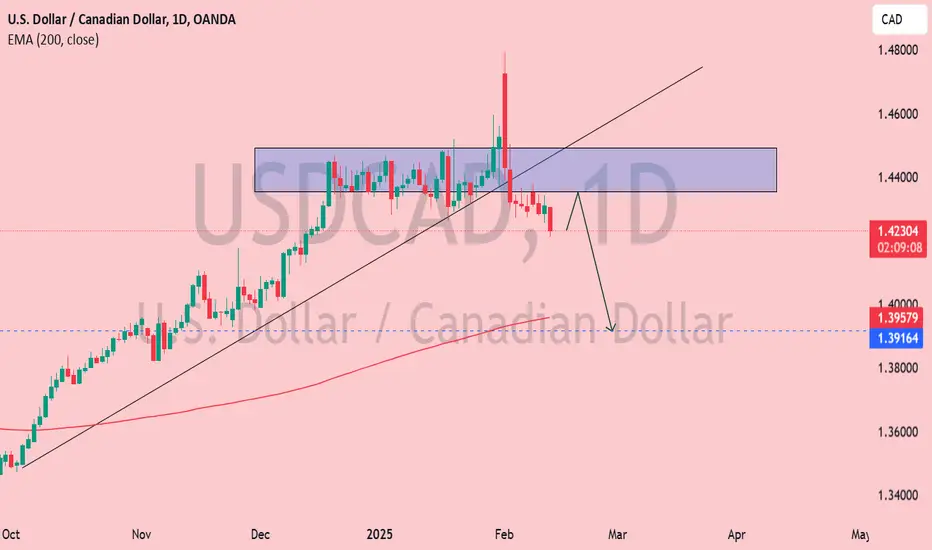
USDCAD Daily Chart Analysis 📉🔥
1️⃣ Trend Breakdown:
The pair was in an uptrend but has now broken below the ascending trendline, signaling a potential bearish shift.
2️⃣ Resistance Zone (Supply Area) 🟦:
The 1.4350 - 1.4450 region acted as resistance, rejecting price strongly.
Multiple rejections in this area indicate strong selling pressure.
3️⃣ Bearish Confirmation 📉:
Price is now trading below the broken trendline.
The recent daily candle closed bearish, confirming sellers are in control.
4️⃣ Key Support Areas 🔍:
1.3957 (200 EMA) → A crucial dynamic support level.
1.3916 → Previous key level that may act as strong demand.
5️⃣ Projected Move ⬇️:
Price may retest the broken trendline (pullback).
If rejection occurs, further drop towards 1.3950 - 1.3910 is likely.
📌 Final Thought:
A bearish move is in play! Watch for a pullback to retest the broken structure before considering further shorts. If price breaks below 1.3950, expect further declines.
💭 What’s your bias? Bulls 🐂 or Bears 🐻?
تم فتح الصفقة
Yep! USDCAD printed another bearish daily candle, confirming selling pressure. 📉🔥
Now, it's at a key decision point—either:
1️⃣ Retrace & push back up if buyers step in. 📈
2️⃣ Continue dropping if sellers stay in control. 📉
🔍 Watch for price action near 1.3950 - 1.3910 (strong support). A bullish rejection there could mean a reversal, while a breakdown signals further downside.
What’s your bias now? Bulls 🐂 or Bears 🐻? 🚀

إخلاء المسؤولية
لا يُقصد بالمعلومات والمنشورات أن تكون، أو تشكل، أي نصيحة مالية أو استثمارية أو تجارية أو أنواع أخرى من النصائح أو التوصيات المقدمة أو المعتمدة من TradingView. اقرأ المزيد في شروط الاستخدام.
إخلاء المسؤولية
لا يُقصد بالمعلومات والمنشورات أن تكون، أو تشكل، أي نصيحة مالية أو استثمارية أو تجارية أو أنواع أخرى من النصائح أو التوصيات المقدمة أو المعتمدة من TradingView. اقرأ المزيد في شروط الاستخدام.