

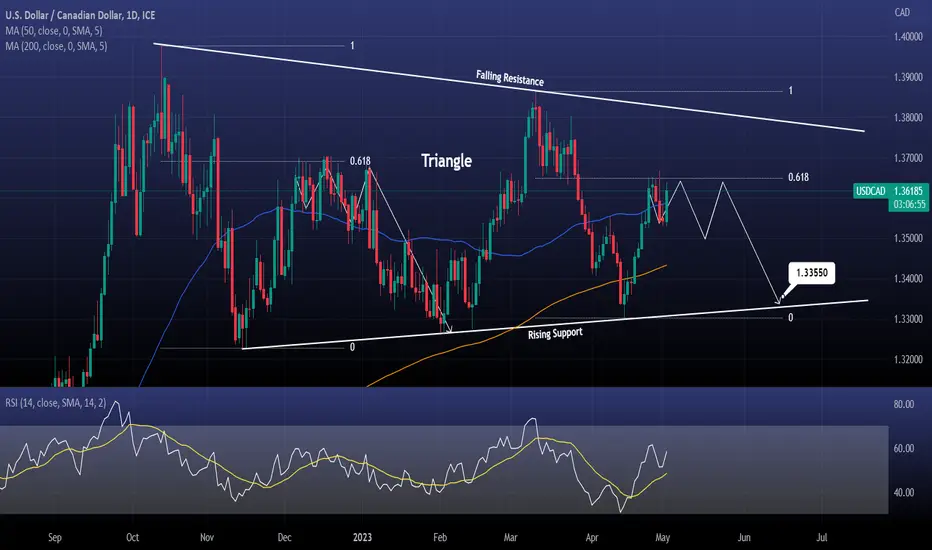
USDCAD is trading inside a Triangle with the price rising after it last hit the pattern's bottom (Rising Support).
It has failed to close over Fibonacci 0.618 on six straight days.
This failure is a technical sign of trend weakness, very much alike the struggle on Fibonacci 0.618 last December.
Sell and target the Rising Support again at 1.33550.
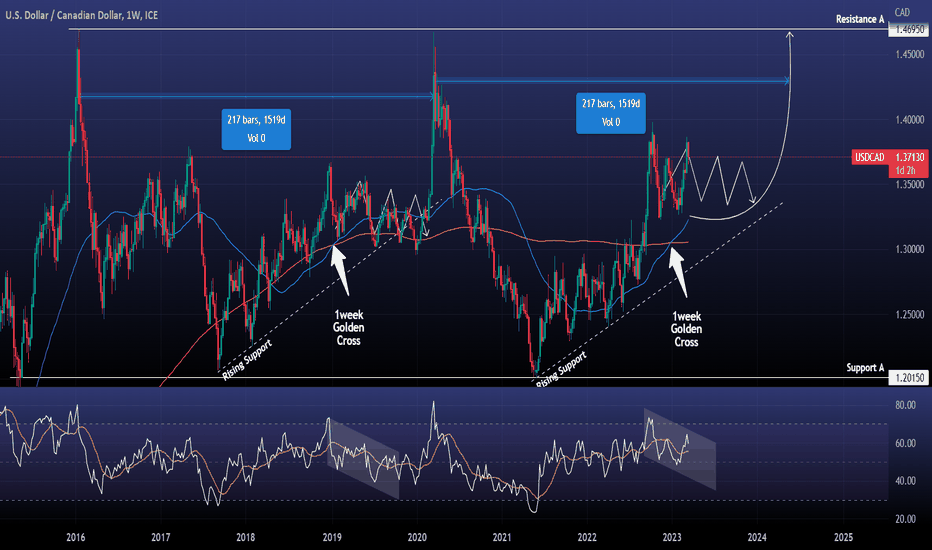
Previous chart:
Follow us, like the idea and leave a comment below!!
It has failed to close over Fibonacci 0.618 on six straight days.
This failure is a technical sign of trend weakness, very much alike the struggle on Fibonacci 0.618 last December.
Sell and target the Rising Support again at 1.33550.
Previous chart:
Follow us, like the idea and leave a comment below!!

thecryptagon.com covers news & insights on global markets (crypto, forex, stocks, commodities)
Institutional services offered:
💰 Daily consulting
💰 Account management
💰 Mentorship
Contact: t.me/thecryptagon | info@thecryptagon.com
Institutional services offered:
💰 Daily consulting
💰 Account management
💰 Mentorship
Contact: t.me/thecryptagon | info@thecryptagon.com
إخلاء المسؤولية
لا يُقصد بالمعلومات والمنشورات أن تكون، أو تشكل، أي نصيحة مالية أو استثمارية أو تجارية أو أنواع أخرى من النصائح أو التوصيات المقدمة أو المعتمدة من TradingView. اقرأ المزيد في شروط الاستخدام.
thecryptagon.com covers news & insights on global markets (crypto, forex, stocks, commodities)
Institutional services offered:
💰 Daily consulting
💰 Account management
💰 Mentorship
Contact: t.me/thecryptagon | info@thecryptagon.com
Institutional services offered:
💰 Daily consulting
💰 Account management
💰 Mentorship
Contact: t.me/thecryptagon | info@thecryptagon.com
إخلاء المسؤولية
لا يُقصد بالمعلومات والمنشورات أن تكون، أو تشكل، أي نصيحة مالية أو استثمارية أو تجارية أو أنواع أخرى من النصائح أو التوصيات المقدمة أو المعتمدة من TradingView. اقرأ المزيد في شروط الاستخدام.