✅ Price Action & Market Structure
USD/CAD
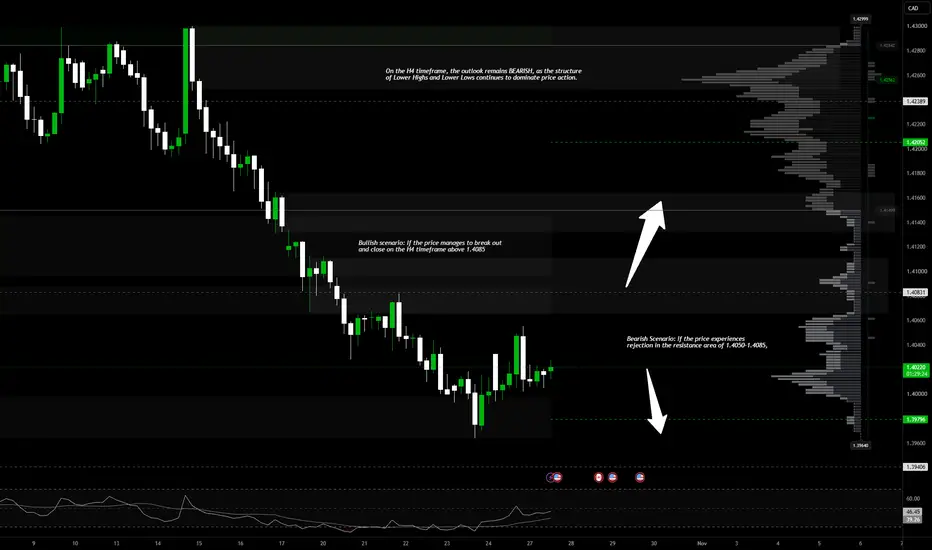
 USDCAD exhibits a bearish market structure following a rejection from the key resistance zone of 1.4280–1.4300. Since this rejection, the price has formed a series of lower highs and lower lows, signaling seller dominance.
The decline has also broken through several previous support levels—including 1.4140–1.4150 and 1.4070–1.4090—which may now act as resistance.
Currently, the price is undergoing consolidation and a limited rebound after touching the demand zone of 1.3965–1.4000. However, there is no confirmation yet of a shift in market structure toward a bullish outlook.
-------------------------------------------------------------------------------------------------------------
✅ Momentum Analysis (RSI)
- The RSI indicator sits at approximately 47.20, suggesting that bearish momentum is beginning to wane following a significant price decline.
- The fact that the RSI is starting to rise from the oversold territory points to the potential for a short-term technical rebound.
- Nevertheless, as long as the RSI remains below the 50 level, bullish momentum is not yet strong enough to confirm a trend reversal. ✅ Key Support & Resistance
- Immediate resistance: 1.4050–1.4085
- Main resistance: 1.4100–1.4150
- Major resistance: 1.4280–1.4300
- Immediate support: 1.4000
- Demand area: 1.3965–1.3995
- Next support: 1.3940
-------------------------------------------------------------------------------------------------------------
✅ Price Movement Projections
- 🔴 Bearish Scenario: If the price faces rejection within the 1.4050–1.4085 resistance area, USD/CAD could weaken toward the 1.4000 support level, subsequently testing the 1.3965–1.3995 demand area. A breakdown below 1.3965 could open the door for a further decline toward 1.3940.
- 🟢 Bullish Scenario: If the price achieves a breakout and closes on the H4 timeframe above 1.4085, USD/CAD may continue its technical rebound toward the 1.4100–1.4150 range. However, such an upward move would still be considered a corrective phase as long as the "Lower High" structure remains intact.
-------------------------------------------------------------------------------------------------------------
✅ Volume Profile Analysis
- Based on the Visible Range Volume Profile, there is a significant concentration of trading volume around the 1.4010–1.4050 level, indicating that this zone serves as a key transaction area for market participants.
- The current price, hovering around 1.4024, suggests a temporary equilibrium between buyers and sellers.
- If the price fails to hold the 1.4000 level, selling pressure is likely to intensify. Conversely, a move above 1.4050 could support a price recovery toward the next resistance level.
USD/CAD
USDCAD exhibits a bearish market structure following a rejection from the key resistance zone of 1.4280–1.4300. Since this rejection, the price has formed a series of lower highs and lower lows, signaling seller dominance.The decline has also broken through several previous support levels—including 1.4140–1.4150 and 1.4070–1.4090—which may now act as resistance.
Currently, the price is undergoing consolidation and a limited rebound after touching the demand zone of 1.3965–1.4000. However, there is no confirmation yet of a shift in market structure toward a bullish outlook.
-------------------------------------------------------------------------------------------------------------
✅ Momentum Analysis (RSI)
- The RSI indicator sits at approximately 47.20, suggesting that bearish momentum is beginning to wane following a significant price decline.
- The fact that the RSI is starting to rise from the oversold territory points to the potential for a short-term technical rebound.
- Nevertheless, as long as the RSI remains below the 50 level, bullish momentum is not yet strong enough to confirm a trend reversal. ✅ Key Support & Resistance
- Immediate resistance: 1.4050–1.4085
- Main resistance: 1.4100–1.4150
- Major resistance: 1.4280–1.4300
- Immediate support: 1.4000
- Demand area: 1.3965–1.3995
- Next support: 1.3940
-------------------------------------------------------------------------------------------------------------
✅ Price Movement Projections
- 🔴 Bearish Scenario: If the price faces rejection within the 1.4050–1.4085 resistance area, USD/CAD could weaken toward the 1.4000 support level, subsequently testing the 1.3965–1.3995 demand area. A breakdown below 1.3965 could open the door for a further decline toward 1.3940.
- 🟢 Bullish Scenario: If the price achieves a breakout and closes on the H4 timeframe above 1.4085, USD/CAD may continue its technical rebound toward the 1.4100–1.4150 range. However, such an upward move would still be considered a corrective phase as long as the "Lower High" structure remains intact.
-------------------------------------------------------------------------------------------------------------
✅ Volume Profile Analysis
- Based on the Visible Range Volume Profile, there is a significant concentration of trading volume around the 1.4010–1.4050 level, indicating that this zone serves as a key transaction area for market participants.
- The current price, hovering around 1.4024, suggests a temporary equilibrium between buyers and sellers.
- If the price fails to hold the 1.4000 level, selling pressure is likely to intensify. Conversely, a move above 1.4050 could support a price recovery toward the next resistance level.

منشورات ذات صلة
إخلاء المسؤولية
لا يُقصد بالمعلومات والمنشورات أن تكون، أو تشكل، أي نصيحة مالية أو استثمارية أو تجارية أو أنواع أخرى من النصائح أو التوصيات المقدمة أو المعتمدة من TradingView. اقرأ المزيد في شروط الاستخدام.
منشورات ذات صلة
إخلاء المسؤولية
لا يُقصد بالمعلومات والمنشورات أن تكون، أو تشكل، أي نصيحة مالية أو استثمارية أو تجارية أو أنواع أخرى من النصائح أو التوصيات المقدمة أو المعتمدة من TradingView. اقرأ المزيد في شروط الاستخدام.