

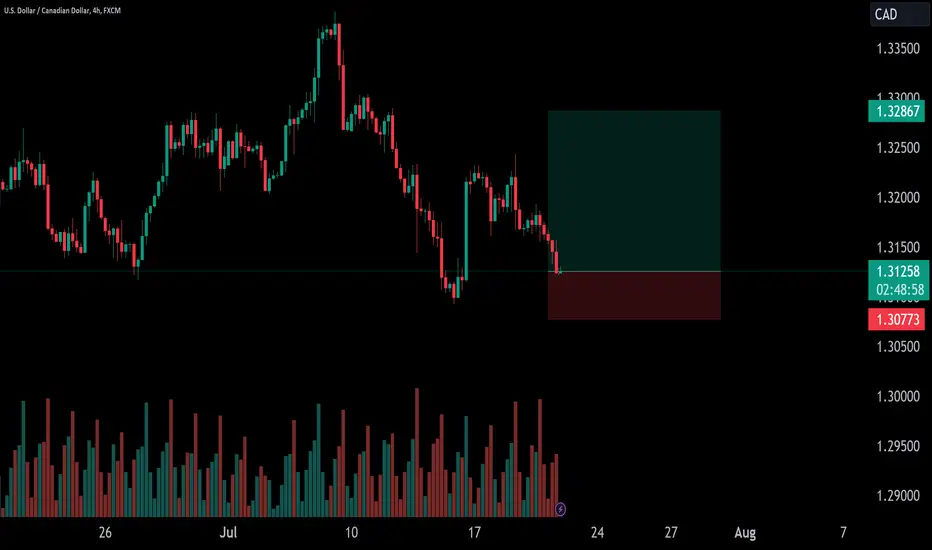
I have identified a potentially bullish move for the USD/CAD forex pair
Ascending Triangle Pattern: On the daily chart, the USD/CAD has been forming an ascending triangle pattern. This pattern is characterized by a horizontal resistance level and higher lows, indicating potential bullish pressure building up. A breakout above the resistance level could trigger a strong upward move.
Bullish Divergence: The Relative Strength Index (RSI) on the daily chart is showing a bullish divergence. While the price has been making lower lows, the RSI is forming higher lows, suggesting that the bearish momentum is weakening and a potential reversal could occur.
Moving Averages: The 50-day moving average (MA) has recently crossed above the 200-day MA, confirming a bullish crossover known as the "golden cross." This crossover signals a shift in momentum and supports the bullish bias.
Support Confirmation: The USD/CAD has recently tested and held firm at a key support level , providing further evidence of potential upward movement.
Ascending Triangle Pattern: On the daily chart, the USD/CAD has been forming an ascending triangle pattern. This pattern is characterized by a horizontal resistance level and higher lows, indicating potential bullish pressure building up. A breakout above the resistance level could trigger a strong upward move.
Bullish Divergence: The Relative Strength Index (RSI) on the daily chart is showing a bullish divergence. While the price has been making lower lows, the RSI is forming higher lows, suggesting that the bearish momentum is weakening and a potential reversal could occur.
Moving Averages: The 50-day moving average (MA) has recently crossed above the 200-day MA, confirming a bullish crossover known as the "golden cross." This crossover signals a shift in momentum and supports the bullish bias.
Support Confirmation: The USD/CAD has recently tested and held firm at a key support level , providing further evidence of potential upward movement.
تم فتح الصفقة
stops moved to breakevenملاحظة
take some profits hereأغلقت الصفقة: تم الوصول للهدف

TradeMaster Discord | Forex & gold signals + Autobot execution on configured MT5. Dated public bot-posted signal outcomes including losses, genuine reviews and community setup help. 7-day signals + Autobot trial: discord.gg/trademaster
إخلاء المسؤولية
لا يُقصد بالمعلومات والمنشورات أن تكون، أو تشكل، أي نصيحة مالية أو استثمارية أو تجارية أو أنواع أخرى من النصائح أو التوصيات المقدمة أو المعتمدة من TradingView. اقرأ المزيد في شروط الاستخدام.
TradeMaster Discord | Forex & gold signals + Autobot execution on configured MT5. Dated public bot-posted signal outcomes including losses, genuine reviews and community setup help. 7-day signals + Autobot trial: discord.gg/trademaster
إخلاء المسؤولية
لا يُقصد بالمعلومات والمنشورات أن تكون، أو تشكل، أي نصيحة مالية أو استثمارية أو تجارية أو أنواع أخرى من النصائح أو التوصيات المقدمة أو المعتمدة من TradingView. اقرأ المزيد في شروط الاستخدام.