

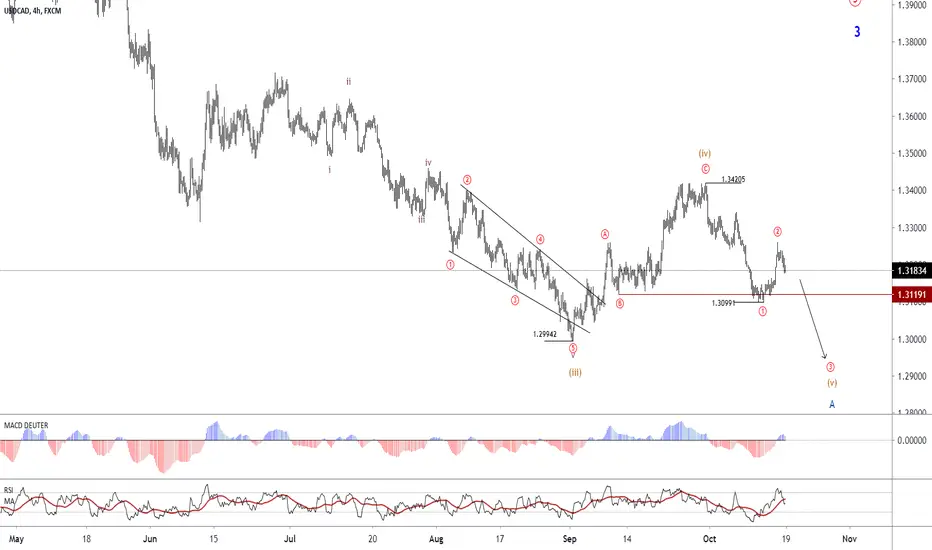
By the price crossing the 1.3099 range, the uptrend encountered some changes, which can be seen in the daily chart.
The overall structure is in the form of a Double Zigzag pattern (in the daily chart) and in the 240-minute chart, the price is completing the V wave from the point of A, which can be extended up to the targets of 1.2950. And in continuation, we enter the corrective (uptrend) to accomplish wave B.
The overall structure is in the form of a Double Zigzag pattern (in the daily chart) and in the 240-minute chart, the price is completing the V wave from the point of A, which can be extended up to the targets of 1.2950. And in continuation, we enter the corrective (uptrend) to accomplish wave B.

إخلاء المسؤولية
لا يُقصد بالمعلومات والمنشورات أن تكون، أو تشكل، أي نصيحة مالية أو استثمارية أو تجارية أو أنواع أخرى من النصائح أو التوصيات المقدمة أو المعتمدة من TradingView. اقرأ المزيد في شروط الاستخدام.
إخلاء المسؤولية
لا يُقصد بالمعلومات والمنشورات أن تكون، أو تشكل، أي نصيحة مالية أو استثمارية أو تجارية أو أنواع أخرى من النصائح أو التوصيات المقدمة أو المعتمدة من TradingView. اقرأ المزيد في شروط الاستخدام.