

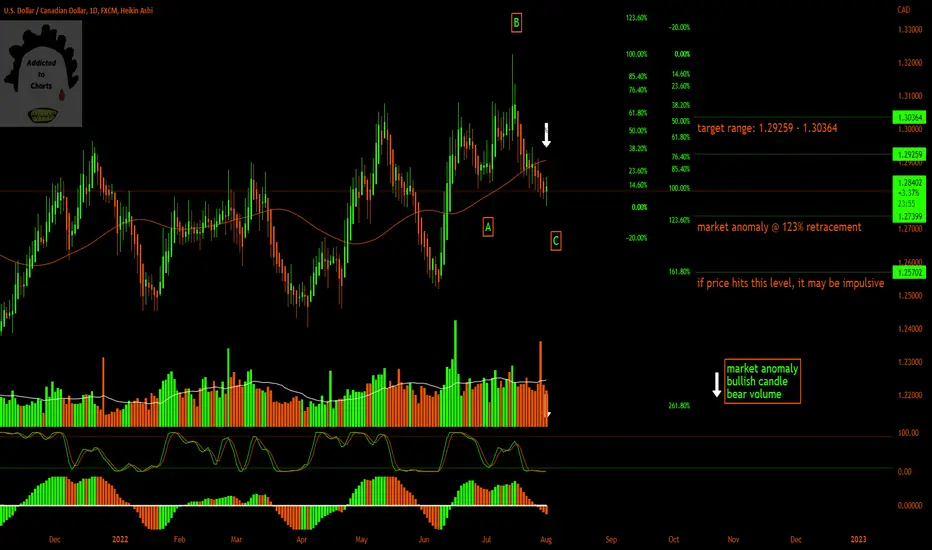
Looks like we located a potential market anomaly on the daily timeframe. Wave C has reached the 123% where the anomaly was spotted (bullish candle, bearish volume). If price reaches 161% before the bullish move, this trend might be impulsive instead of corrective. Looking for price to test the high of wave B between 38% to 61%. The RSI and MACD are both matching the bottom side. Happy trading!
What do you think?
What do you think?

إخلاء المسؤولية
لا يُقصد بالمعلومات والمنشورات أن تكون، أو تشكل، أي نصيحة مالية أو استثمارية أو تجارية أو أنواع أخرى من النصائح أو التوصيات المقدمة أو المعتمدة من TradingView. اقرأ المزيد في شروط الاستخدام.
إخلاء المسؤولية
لا يُقصد بالمعلومات والمنشورات أن تكون، أو تشكل، أي نصيحة مالية أو استثمارية أو تجارية أو أنواع أخرى من النصائح أو التوصيات المقدمة أو المعتمدة من TradingView. اقرأ المزيد في شروط الاستخدام.