

1. Price Structure
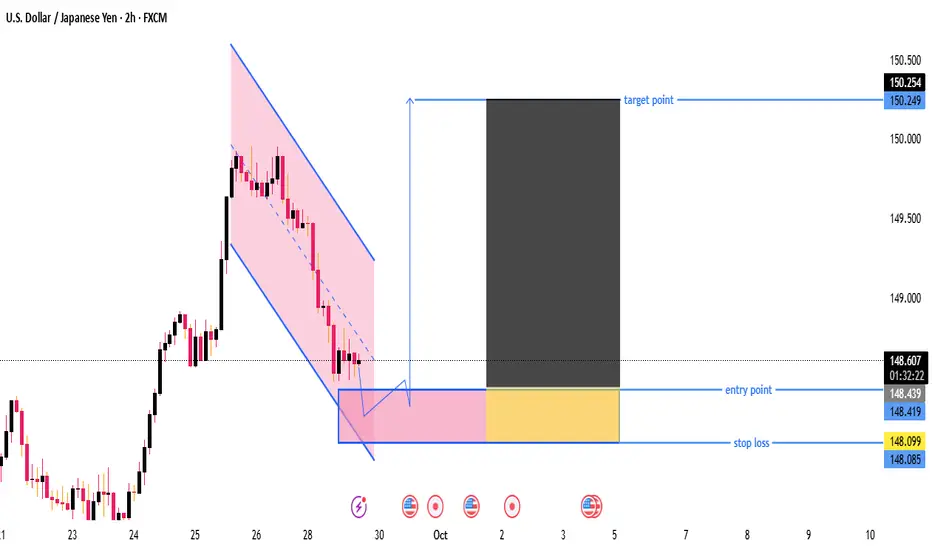
Price has been in a downtrend channel (highlighted in pink).
It has reached the lower boundary of the channel and seems to be consolidating.
This suggests a possible reversal or breakout to the upside.
2. Entry Point
Marked near 148.419 – 148.439.
This is right at the bottom of the consolidation zone, just above the support area.
3. Stop Loss
Placed around 148.085 – 148.099 (yellow box).
Smartly set below the most recent low to protect against further downside if price breaks support.
4. Target
Target point is at 150.249.
This is a big upside move (around 180 pips from entry).
Good risk-to-reward ratio (approx. 1:4), meaning potential profit is much higher than potential loss.
5. Market Context
The chart suggests that once price breaks above the small downtrend (dashed blue line), it could push strongly upward.
This looks like a bullish flag pattern, which is generally a continuation pattern in an uptrend.
---
📊 Conclusion
Bias: Bullish (buy setup)
Reason: Price is at channel support + entry is near demand zone + bullish breakout potential.
Plan: Buy near 148.42 with stop loss at 148.09 and target 150.25.
Risk/Reward: Favorable (good setup if price respects support and breaks upward).
⚠ Key Risk: If price closes below 148.09 support, this setup becomes invalid and could drop further.
Price has been in a downtrend channel (highlighted in pink).
It has reached the lower boundary of the channel and seems to be consolidating.
This suggests a possible reversal or breakout to the upside.
2. Entry Point
Marked near 148.419 – 148.439.
This is right at the bottom of the consolidation zone, just above the support area.
3. Stop Loss
Placed around 148.085 – 148.099 (yellow box).
Smartly set below the most recent low to protect against further downside if price breaks support.
4. Target
Target point is at 150.249.
This is a big upside move (around 180 pips from entry).
Good risk-to-reward ratio (approx. 1:4), meaning potential profit is much higher than potential loss.
5. Market Context
The chart suggests that once price breaks above the small downtrend (dashed blue line), it could push strongly upward.
This looks like a bullish flag pattern, which is generally a continuation pattern in an uptrend.
---
📊 Conclusion
Bias: Bullish (buy setup)
Reason: Price is at channel support + entry is near demand zone + bullish breakout potential.
Plan: Buy near 148.42 with stop loss at 148.09 and target 150.25.
Risk/Reward: Favorable (good setup if price respects support and breaks upward).
⚠ Key Risk: If price closes below 148.09 support, this setup becomes invalid and could drop further.

join my telegram channel t.me/smartforexacademy45 t.me/smartforexacademy45
JOIN MY REFREL BROKER LINK one.exnessonelink.com/a/gissbq1h9c?source=app
JOIN MY REFREL BROKER LINK one.exnessonelink.com/a/gissbq1h9c?source=app
إخلاء المسؤولية
لا يُقصد بالمعلومات والمنشورات أن تكون، أو تشكل، أي نصيحة مالية أو استثمارية أو تجارية أو أنواع أخرى من النصائح أو التوصيات المقدمة أو المعتمدة من TradingView. اقرأ المزيد في شروط الاستخدام.
join my telegram channel t.me/smartforexacademy45 t.me/smartforexacademy45
JOIN MY REFREL BROKER LINK one.exnessonelink.com/a/gissbq1h9c?source=app
JOIN MY REFREL BROKER LINK one.exnessonelink.com/a/gissbq1h9c?source=app
إخلاء المسؤولية
لا يُقصد بالمعلومات والمنشورات أن تكون، أو تشكل، أي نصيحة مالية أو استثمارية أو تجارية أو أنواع أخرى من النصائح أو التوصيات المقدمة أو المعتمدة من TradingView. اقرأ المزيد في شروط الاستخدام.