

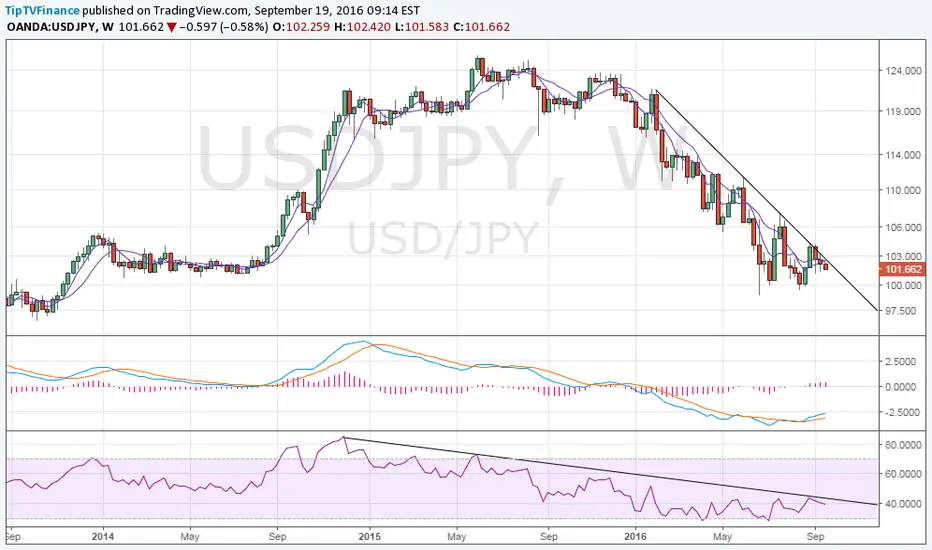
Weekly chart shows the descending trend line on the price chart and RSI is very much intact.
However, note the repeated rebound from near 99-100 levels and the bullish crossover between MACD lines.
Hence, the odds of the pair breaching the descending trendline are high and a much safer short trade would be below 100.00 levels.
However, note the repeated rebound from near 99-100 levels and the bullish crossover between MACD lines.
Hence, the odds of the pair breaching the descending trendline are high and a much safer short trade would be below 100.00 levels.

منشورات ذات صلة
إخلاء المسؤولية
لا يُقصد بالمعلومات والمنشورات أن تكون، أو تشكل، أي نصيحة مالية أو استثمارية أو تجارية أو أنواع أخرى من النصائح أو التوصيات المقدمة أو المعتمدة من TradingView. اقرأ المزيد في شروط الاستخدام.
منشورات ذات صلة
إخلاء المسؤولية
لا يُقصد بالمعلومات والمنشورات أن تكون، أو تشكل، أي نصيحة مالية أو استثمارية أو تجارية أو أنواع أخرى من النصائح أو التوصيات المقدمة أو المعتمدة من TradingView. اقرأ المزيد في شروط الاستخدام.