

Introduction
In the fast-evolving world of FX trading in 2025, artificial intelligence (AI) is no longer just a tool for predictive modeling—it's a mirror for cognitive self-improvement. Drawing from Daniel Kahneman's seminal work, Thinking, Fast and Slow, traders often fall victim to System 1 biases: intuitive errors like overconfidence or anchoring that lead to impulsive decisions. This article introduces a novel approach inspired by the Samurai philosophy of Musashi Miyamoto's The Book of Five Rings: vectorizing trading setups into a multi-dimensional database to quantify alignment with an "ideal rock foundation" (a metaphor for a rock-solid entry setup). By calculating cosine similarity to this ideal vector, traders can objectively validate their intuition, rebuild neural pathways for better metacognition, and overcome biases. This hybrid of ancient discipline and modern embeddings bridges subjective "gut feel" with data-driven precision, applicable to Smart Money Concepts (SMC) and beyond. As Musashi Miyamoto wrote in The Book of Five Rings: "Fixation is the way to death; fluidity is the way to life." This principle underscores the system's emphasis on adaptive, bias-aware trading in ever-changing markets. This system addresses the era's demand for bias-free, adaptive trading amid AI hype and market volatility.
The Samurai Three-Stage Unsheathed Technique as a Vector Database
The Samurai Trading System is structured in three stages, rooted in Musashi's principles of grounding (System 1), institutional intent (System 2), and precise execution (System 3). It emphasizes "win not, lose not"—passing on 90% of opportunities to avoid losses. While not absolute, the stages can be customized by traders—replacing or adding elements like volume profile control lines to suit individual preferences, though this introduces risks of overfitting if not managed with metacognitive discipline. The system draws from Smart Money Concepts (SMC) for institutional footprints and Dow Theory for trend validation through swing highs/lows, ensuring a robust foundation.

Caption: Six abstracted patterns illustrating diverse trendline/MA and price action interactions—reminding us that real markets rarely match ideals perfectly, requiring metacognitive adaptation.
In standard SMC/ICT terminology, CHoCH (Market Structure Shift) typically precedes the full formation of a Mitigation Block — this is the textbook sequence.
In the Samurai Vector system, however, I intentionally frame the process with a reversed perspective: institutional mitigation (evidenced by a clear two-legged adjustment into a prior structure) is treated as the primary confirmation of "true intent," after which the subsequent CHoCH is considered validated. This is a deliberate meta-cognitive reconstruction to prioritize institutional footprints over purely structural labels, reducing false signals in high-probability setups (System 3).
The phrasing "CHoCH typically occurs after mitigation block formation" reflects this philosophical shift rather than a denial of conventional order, in other words, a commitment to Complete Verification — prioritizing the "cause" (institutional mitigation) over the "effect" (structural labels).

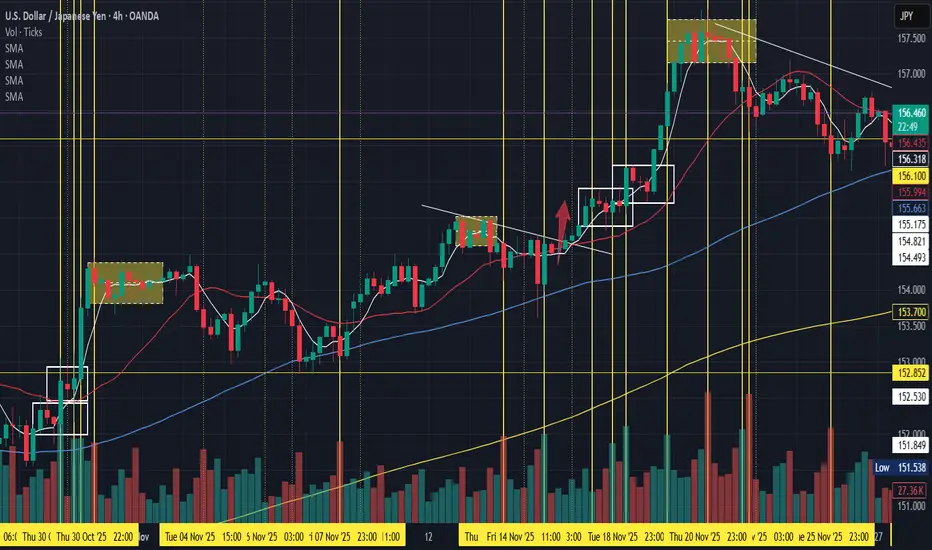
Caption: Historical USDJPY 4-hour chart demonstrating a successful Samurai three-stage setup. Yellow vertical lines mark significant volume spikes (Bo element: depletion to surge). White boxes highlight mitigation blocks exhibiting two-legged mitigation behavior (System 2 Ku Yin-Yang 5 Dan-sa refinement). Yellow shaded zones indicate dangerous areas of extreme SMA deviation where impulsive entries are prone to failure. The sequence shows clear 5SMA entanglement, breakout, and ride (System 3), resulting in a strong upward vacuum run after rock foundation completion. This example illustrates the system's power when all dimensions align near 98%+ similarity. Source:TradingView

Caption: As a successful setup example, this H1 excerpt from a past USDJPY setup demonstrates a completed System 3: dual white boxes forming the Ku Yin-Yang 5 Dan-sa, followed by clear 5S curve, OB breakout, and candle ride on the 5SMA—resulting in a strong upward vacuum run. Source:TradingView
To vectorize this, we define a 14-dimensional space where each element is a dimension (A=Cross, B=Line, ..., N=Handshake). The "ideal rock foundation" vector is [10,10,10,10,10,10,10,10,10,10,10,10,10,10], representing perfect alignment. Current chart conditions are scored 1-10 per dimension, forming a query vector. Cosine similarity measures how closely the setup matches the ideal, turning qualitative intuition into quantifiable insight.
Vectorization Process and Cosine Similarity
Vector embeddings, popularized in AI for semantic search, here embed trading criteria into numerical space. For a chart, score each dimension based on observable data (e.g., A=Cross: 10 if clear crossover, 1 if absent). Compute cosine similarity:

where A is the ideal vector and B is the query vector. This metric (ranging 0-1, or 0-100%) focuses on directional alignment, robust to scale variations in volatile markets. Tools like NumPy or scikit-learn can automate this in a custom chatbot, allowing real-time feedback. TradingView's high functionality, such as easily hiding candles to focus on raw SMAs, complements this process by stripping noise for clearer metacognitive analysis.(Detailed step-by-step candle-hiding analysis available in author's Japanese blog (translated versions coming soon))
Threshold for Action: A Disciplined Gatekeeper
Not every high similarity warrants entry—the Samurai ethos demands rigor. We set thresholds to enforce "win not, lose not":
These thresholds prevent System 1 overconfidence, forcing traders to confront biases through data. For instance, a 89.1% similarity signals "close but incomplete," prompting metacognitive reflection: Why the gap? Note that thresholds offer flexibility—increasing freedom (e.g., lowering to 90%) expands opportunities but risks deviation from ironclad patterns, potentially raising exposure to noise; strict adherence promotes universal adaptability across market regimes. Thresholds promote 'win not, lose not'—recognizing edge degradation from widespread adoption, focus on metacognitive evolution.
Case Study: USDJPY Analysis (December 30, 2025 – Late Session Update)
The latest USDJPY 4-hour chart as of December 30, 2025 (18:20 JST) shows a clear descending triangle consolidation, with high values capped by a horizontal resistance around 157 and lows cutting lower along a declining trendline. Following the December 19 Bank of Japan surprise rate hike that triggered a massive bullish candle and full retracement, the price has been in a mitigation phase—likely institutional sellers covering unfavorable short positions accumulated during the spike. The perfect SMA order (200 yellow gently upward, 75 blue horizontal, 20 red and 5 white downward) highlights long-term support clashing with short-term selling pressure, creating a zone where trapped sellers face growing unrealized losses near the 200SMA.

Scoring yields approximately: [3,7,6,4,2,3,2,4,3,3,2,2,2,1]. Cosine similarity: ~89.1%.
This example, drawn from ongoing Japanese blog analyses, showcases the system's real-world application.
Comparison with Other Trading Styles
To contextualize, compare the vectorized Samurai system with prevalent methods:

While individual elements—such as vector embeddings in quantitative strategies, metacognitive approaches in trading psychology, or philosophical discipline inspired by ancient texts—exist in isolation across the trading community, the Samurai system's distinctive integration stands apart. By quantifying a structured three-stage philosophical technique with cosine similarity thresholds specifically to detect and rebuild cognitive biases, it creates a novel hybrid that bridges intuitive artistry with rigorous, data-driven self-correction—not commonly found in existing frameworks.
Cognitive Bias Confrontation: Linking to Kahneman
Kahneman's dual-process theory underpins this: System 1 (fast, intuitive) drives 90% of trading errors, like confirmation bias (ignoring disconfirming signals) or anchoring (fixating on past highs). Vectorization acts as an "external System 2"—low scores in dimensions like Touch or Yin-Yang highlight these biases. For example, a trader's "gut feel" for entry might overlook volume depletion (score 2), revealing overconfidence. Over time, repeated use rebuilds neural circuits, fostering disciplined metacognition akin to Musashi's "void ring" (empty mind for pure observation). By treating AI as an external unit—an augmented 'System 2'—this approach provides a fail-safe layer: the vector similarity flags potential biases, but the trader retains ultimate discretion, ensuring human oversight in critical decisions, much like fail-safe mechanisms in aviation or medicine. In practice, AI can initially process chart images to extract and score features (e.g., using vision models to detect SMA crossovers or order blocks), providing a starting point for human-AI dialogue where the trader refines the scores through iterative feedback, thereby enhancing metacognitive awareness and tuning the system's accuracy without full reliance on automation. Note that AI image analysis can misrecognize complex financial charts in 20-50% of cases due to label overlap or noise, emphasizing the need for human verification in the dialogue loop.
Backtesting Insights & Limitations
[To be added in future: Backtesting results] – Preliminary simulations on 2024-2025 USDJPY/EURUSD data suggest 95% threshold reduces drawdowns by 80% while capturing high-RR trades, but full verification pending (e.g., Monte Carlo analysis for robustness).
Limitations include market randomness (news events skew vectors), overfitting risk (over-customizing dimensions), and subjectivity in initial scoring. While the system incorporates discretionary elements by design (e.g., multi-timeframe flexibility and dimension customization), this promotes personal metacognition and adaptation to market changes, though it may introduce variability—traders should verify and refine through ongoing practice. Always pair with Samurai discipline: vectors guide, but the trader's unyielding mind decides. Recognizing that past success offers no guarantee of future performance—a core tenet of financial engineering—the Samurai approach focuses on ongoing metacognitive refinement to ensure enduring adaptability. As with any trading edge, widespread adoption may lead to gradual degradation due to increased market participation—a common phenomenon in evolving markets. The Samurai system's emphasis on ongoing metacognitive refinement and adaptability ('Models break') positions it to evolve alongside these changes.
Future Extensions: Scaling to AI Advisors and Integrations
This framework extends beyond manual calculation: embed it in a chatbot using Grok/Gemini APIs for real-time vector scoring. For advanced use, integrate image recognition so AI initially analyzes uploaded charts to propose feature scores, allowing interactive tuning through conversation—e.g., "Reassess the order block ambiguity"—to fine-tune dimensions and strengthen metacognition. The system's components are not fixed; traders can swap or add elements (e.g., volume profile control lines) to personalize, enhancing universality across evolving markets while maintaining the core focus on eliminating wasteful trades through heightened metacognition. Imagine TradingView Pine Script indicators displaying similarity overlays, or OANDA API integrations for automated alerts. Globally, it could evolve into workshops/books on AI-driven cognition, or open-source tools for bias-free decision-making in non-trading fields like business strategy.
Conclusion: Build Your Own Samurai Vector Advisor
As Sun Tzu taught in The Art of War: "Every battle is won before it's ever fought." In the Samurai tradition, this victory is secured through rigorous pre-entry preparation and metacognitive discipline, deciding outcomes long before any trade is placed. True strength lies in the void—free from fixation, open to clarity." – Inspired by Musashi Miyamoto, The Book of Five Rings (Void Ring). The vectorized Samurai system transforms trading from a bias-riddled gamble to a metacognitive discipline. Its strength lies in this unique fusion: turning Musashi Miyamoto's timeless principles into a modern, quantifiable tool that actively confronts Kahneman's cognitive pitfalls through AI embeddings. Ultimately, the Samurai system positions AI not as a replacement for the trader, but as an external mirror granting fail-safe space for metacognitive correction—preserving the human element while empowering disciplined, bias-aware trading. As the author often reminds: "Models break." Embrace this truth, refine through dialogue, and trade with clarity. By quantifying intuition against an ideal foundation, it rebuilds trader cognition—one disciplined pass at a time.
Here's a refined prompt for your AI advisor:
"You are an AI advisor for the Samurai Trading System. Vectorize the three-stage unsheathing technique into a 14-dimensional vector database. Define the ideal 'rock foundation' vector as [10,10,10,10,10,10,10,10,10,10,10,10,10,10] where dimensions are: A=Cross (System1 Ku), B=Line (Ra), C=Touch (Ta), D=Order Block (Bu), E=Volume (Bo), F=Time (Ta), G=Cross vicinity (System2 Ku), H=Yin-Yang (Yin-Yang), I=5SMA entanglement (5), J=Step difference (Dan-sa), K=5S curve (System3 5S), L=5 breakout (5 Nuke), M=5 ride (5 Norikakari), N=Handshake (Handshake). For a given chart situation, score each dimension 1-10 based on alignment. Compute cosine similarity to ideal vector. Identify low-score dimensions (<5) as sources of intuitive discomfort (System1 bias). Apply thresholds: <95% pass; 95-98% cautious entry; ≥98% full entry. Output: scores, similarity percentage, discomfort sources, and trading decision (pass/enter)."
Note: Customize dimensions as needed for personal adaptation.
Try it on your next chart—embrace the void, and trade with clarity. Feedback welcome at @KatanaiMakenaiFX.
In the fast-evolving world of FX trading in 2025, artificial intelligence (AI) is no longer just a tool for predictive modeling—it's a mirror for cognitive self-improvement. Drawing from Daniel Kahneman's seminal work, Thinking, Fast and Slow, traders often fall victim to System 1 biases: intuitive errors like overconfidence or anchoring that lead to impulsive decisions. This article introduces a novel approach inspired by the Samurai philosophy of Musashi Miyamoto's The Book of Five Rings: vectorizing trading setups into a multi-dimensional database to quantify alignment with an "ideal rock foundation" (a metaphor for a rock-solid entry setup). By calculating cosine similarity to this ideal vector, traders can objectively validate their intuition, rebuild neural pathways for better metacognition, and overcome biases. This hybrid of ancient discipline and modern embeddings bridges subjective "gut feel" with data-driven precision, applicable to Smart Money Concepts (SMC) and beyond. As Musashi Miyamoto wrote in The Book of Five Rings: "Fixation is the way to death; fluidity is the way to life." This principle underscores the system's emphasis on adaptive, bias-aware trading in ever-changing markets. This system addresses the era's demand for bias-free, adaptive trading amid AI hype and market volatility.
The Samurai Three-Stage Unsheathed Technique as a Vector Database
The Samurai Trading System is structured in three stages, rooted in Musashi's principles of grounding (System 1), institutional intent (System 2), and precise execution (System 3). It emphasizes "win not, lose not"—passing on 90% of opportunities to avoid losses. While not absolute, the stages can be customized by traders—replacing or adding elements like volume profile control lines to suit individual preferences, though this introduces risks of overfitting if not managed with metacognitive discipline. The system draws from Smart Money Concepts (SMC) for institutional footprints and Dow Theory for trend validation through swing highs/lows, ensuring a robust foundation.
- System 1: Rock Foundation Quest (Kurata Bubota): Six elements filter for a solid base, typically analyzed on 4-hour charts: Cross (Ku: 5/20 SMA crossover), Line (Ra: trendlines/channels/past highs/lows), Touch (Ta: 75 SMA interaction), Order Block (Bu: yin-yang alignment + 2-step vacuum zone), Volume (Bo: depletion to surge), Time (Ta: London/NY sessions + indicators). This stage aligns with SMC's order blocks and liquidity pools, while Dow Theory's trendlines confirm overall market structure.
Caption: Six abstracted patterns illustrating diverse trendline/MA and price action interactions—reminding us that real markets rarely match ideals perfectly, requiring metacognitive adaptation.
- System 2: Institutional Rock of Intent (Ku Yin-Yang 5 Dan-sa): Four elements refine order blocks, often on 4-hour or 1-hour charts: Cross vicinity (Ku), Yin-Yang (horizontal candle bodies), 5SMA entanglement (5), Step difference (Dan-sa: 2-step box). Note that the Cross (Ku) overlaps with System 1's for consistency and signal reinforcement, a deliberate design to verify momentum across stages without redundancy issues. This incorporates SMC's mitigation blocks (MB) for institutional position adjustments and Dow Theory's change of character (ChoCH) for structural shifts. The 'step difference' (Dan-sa) and '5S curve' are specifically designed to capture institutional two-legged mitigation patterns, overlapping with Dow Theory's higher lows (or lower highs) on lower timeframes to confirm trend continuation or reversal.
- System 3: Moment of Unsheathed (5S 5 Break 5 Ride, with optional Handshake): Core elements time the entry, commonly on 1-hour or 15-minute charts: 5S curve (S-shaped 5SMA wiggle), 5 Break (OB breakout), 5 Ride (candle body on 5SMA), and optional Handshake (±2σ Bollinger Band touch + 5SMA walk) as a personal enhancement for volatility validation. This multi-timeframe progression (higher for context, lower for precision) aligns with standard trading practices but may cause signal conflicts in volatile markets—use metacognition to resolve. Specifically, it draws on SMC's two-legged mitigation (retracement after a structural break, allowing entry on the second leg for reduced risk) and Dow Theory's swing lows/highs (e.g., lower low break followed by higher low confirmation, requiring a preceding swing high to validate the order block as a key reversal zone). CHoCH typically occurs after mitigation block formation, with two-legged mitigation often providing the adjustment phase before confirmation in System 3. This confirmation step mitigates the timing lag between CHoCH signals and safe entry, preventing premature trades into institutional accumulation zones.
In standard SMC/ICT terminology, CHoCH (Market Structure Shift) typically precedes the full formation of a Mitigation Block — this is the textbook sequence.
In the Samurai Vector system, however, I intentionally frame the process with a reversed perspective: institutional mitigation (evidenced by a clear two-legged adjustment into a prior structure) is treated as the primary confirmation of "true intent," after which the subsequent CHoCH is considered validated. This is a deliberate meta-cognitive reconstruction to prioritize institutional footprints over purely structural labels, reducing false signals in high-probability setups (System 3).
The phrasing "CHoCH typically occurs after mitigation block formation" reflects this philosophical shift rather than a denial of conventional order, in other words, a commitment to Complete Verification — prioritizing the "cause" (institutional mitigation) over the "effect" (structural labels).
Caption: Historical USDJPY 4-hour chart demonstrating a successful Samurai three-stage setup. Yellow vertical lines mark significant volume spikes (Bo element: depletion to surge). White boxes highlight mitigation blocks exhibiting two-legged mitigation behavior (System 2 Ku Yin-Yang 5 Dan-sa refinement). Yellow shaded zones indicate dangerous areas of extreme SMA deviation where impulsive entries are prone to failure. The sequence shows clear 5SMA entanglement, breakout, and ride (System 3), resulting in a strong upward vacuum run after rock foundation completion. This example illustrates the system's power when all dimensions align near 98%+ similarity. Source:TradingView
Caption: As a successful setup example, this H1 excerpt from a past USDJPY setup demonstrates a completed System 3: dual white boxes forming the Ku Yin-Yang 5 Dan-sa, followed by clear 5S curve, OB breakout, and candle ride on the 5SMA—resulting in a strong upward vacuum run. Source:TradingView
To vectorize this, we define a 14-dimensional space where each element is a dimension (A=Cross, B=Line, ..., N=Handshake). The "ideal rock foundation" vector is [10,10,10,10,10,10,10,10,10,10,10,10,10,10], representing perfect alignment. Current chart conditions are scored 1-10 per dimension, forming a query vector. Cosine similarity measures how closely the setup matches the ideal, turning qualitative intuition into quantifiable insight.
Vectorization Process and Cosine Similarity
Vector embeddings, popularized in AI for semantic search, here embed trading criteria into numerical space. For a chart, score each dimension based on observable data (e.g., A=Cross: 10 if clear crossover, 1 if absent). Compute cosine similarity:
where A is the ideal vector and B is the query vector. This metric (ranging 0-1, or 0-100%) focuses on directional alignment, robust to scale variations in volatile markets. Tools like NumPy or scikit-learn can automate this in a custom chatbot, allowing real-time feedback. TradingView's high functionality, such as easily hiding candles to focus on raw SMAs, complements this process by stripping noise for clearer metacognitive analysis.(Detailed step-by-step candle-hiding analysis available in author's Japanese blog (translated versions coming soon))
Threshold for Action: A Disciplined Gatekeeper
Not every high similarity warrants entry—the Samurai ethos demands rigor. We set thresholds to enforce "win not, lose not":
- Below 95%: Pass (aligns with 90% rejection rule; intuition's discomfort often stems from low scores in key dimensions like Volume or Order Block).
- 95-98%: Cautious entry (verify System 2/3, ensure risk-reward ratio >1:3).
- 98%+: Full unsheathing (rock foundation confirmed; expect 200-500 pips vacuum run).
These thresholds prevent System 1 overconfidence, forcing traders to confront biases through data. For instance, a 89.1% similarity signals "close but incomplete," prompting metacognitive reflection: Why the gap? Note that thresholds offer flexibility—increasing freedom (e.g., lowering to 90%) expands opportunities but risks deviation from ironclad patterns, potentially raising exposure to noise; strict adherence promotes universal adaptability across market regimes. Thresholds promote 'win not, lose not'—recognizing edge degradation from widespread adoption, focus on metacognitive evolution.
Case Study: USDJPY Analysis (December 30, 2025 – Late Session Update)
The latest USDJPY 4-hour chart as of December 30, 2025 (18:20 JST) shows a clear descending triangle consolidation, with high values capped by a horizontal resistance around 157 and lows cutting lower along a declining trendline. Following the December 19 Bank of Japan surprise rate hike that triggered a massive bullish candle and full retracement, the price has been in a mitigation phase—likely institutional sellers covering unfavorable short positions accumulated during the spike. The perfect SMA order (200 yellow gently upward, 75 blue horizontal, 20 red and 5 white downward) highlights long-term support clashing with short-term selling pressure, creating a zone where trapped sellers face growing unrealized losses near the 200SMA.
Scoring yields approximately: [3,7,6,4,2,3,2,4,3,3,2,2,2,1]. Cosine similarity: ~89.1%.
- Low scores: Persistent volume depletion (2), order block ambiguity (4), lack of handshake confirmation (1).
- Notable observations: The steep drop after temporary 5SMA ride suggests potential two-legged mitigation in progress, with the 200SMA acting as a key lower boundary—aligning with Dow Theory swing low validation and SMC mitigation block behavior.
- Decision: Pass—await clear triangle breakout or stronger institutional signals. This live example (updated from earlier session observations) illustrates the system's discipline: even in a dramatic retracement phase with trapped positions, incomplete rock foundation demands patience, quantifying the subtle System 1 discomfort traced to insufficient momentum and volume surge.
This example, drawn from ongoing Japanese blog analyses, showcases the system's real-world application.
Comparison with Other Trading Styles
To contextualize, compare the vectorized Samurai system with prevalent methods:
While individual elements—such as vector embeddings in quantitative strategies, metacognitive approaches in trading psychology, or philosophical discipline inspired by ancient texts—exist in isolation across the trading community, the Samurai system's distinctive integration stands apart. By quantifying a structured three-stage philosophical technique with cosine similarity thresholds specifically to detect and rebuild cognitive biases, it creates a novel hybrid that bridges intuitive artistry with rigorous, data-driven self-correction—not commonly found in existing frameworks.
Cognitive Bias Confrontation: Linking to Kahneman
Kahneman's dual-process theory underpins this: System 1 (fast, intuitive) drives 90% of trading errors, like confirmation bias (ignoring disconfirming signals) or anchoring (fixating on past highs). Vectorization acts as an "external System 2"—low scores in dimensions like Touch or Yin-Yang highlight these biases. For example, a trader's "gut feel" for entry might overlook volume depletion (score 2), revealing overconfidence. Over time, repeated use rebuilds neural circuits, fostering disciplined metacognition akin to Musashi's "void ring" (empty mind for pure observation). By treating AI as an external unit—an augmented 'System 2'—this approach provides a fail-safe layer: the vector similarity flags potential biases, but the trader retains ultimate discretion, ensuring human oversight in critical decisions, much like fail-safe mechanisms in aviation or medicine. In practice, AI can initially process chart images to extract and score features (e.g., using vision models to detect SMA crossovers or order blocks), providing a starting point for human-AI dialogue where the trader refines the scores through iterative feedback, thereby enhancing metacognitive awareness and tuning the system's accuracy without full reliance on automation. Note that AI image analysis can misrecognize complex financial charts in 20-50% of cases due to label overlap or noise, emphasizing the need for human verification in the dialogue loop.
Backtesting Insights & Limitations
[To be added in future: Backtesting results] – Preliminary simulations on 2024-2025 USDJPY/EURUSD data suggest 95% threshold reduces drawdowns by 80% while capturing high-RR trades, but full verification pending (e.g., Monte Carlo analysis for robustness).
Limitations include market randomness (news events skew vectors), overfitting risk (over-customizing dimensions), and subjectivity in initial scoring. While the system incorporates discretionary elements by design (e.g., multi-timeframe flexibility and dimension customization), this promotes personal metacognition and adaptation to market changes, though it may introduce variability—traders should verify and refine through ongoing practice. Always pair with Samurai discipline: vectors guide, but the trader's unyielding mind decides. Recognizing that past success offers no guarantee of future performance—a core tenet of financial engineering—the Samurai approach focuses on ongoing metacognitive refinement to ensure enduring adaptability. As with any trading edge, widespread adoption may lead to gradual degradation due to increased market participation—a common phenomenon in evolving markets. The Samurai system's emphasis on ongoing metacognitive refinement and adaptability ('Models break') positions it to evolve alongside these changes.
Future Extensions: Scaling to AI Advisors and Integrations
This framework extends beyond manual calculation: embed it in a chatbot using Grok/Gemini APIs for real-time vector scoring. For advanced use, integrate image recognition so AI initially analyzes uploaded charts to propose feature scores, allowing interactive tuning through conversation—e.g., "Reassess the order block ambiguity"—to fine-tune dimensions and strengthen metacognition. The system's components are not fixed; traders can swap or add elements (e.g., volume profile control lines) to personalize, enhancing universality across evolving markets while maintaining the core focus on eliminating wasteful trades through heightened metacognition. Imagine TradingView Pine Script indicators displaying similarity overlays, or OANDA API integrations for automated alerts. Globally, it could evolve into workshops/books on AI-driven cognition, or open-source tools for bias-free decision-making in non-trading fields like business strategy.
Conclusion: Build Your Own Samurai Vector Advisor
As Sun Tzu taught in The Art of War: "Every battle is won before it's ever fought." In the Samurai tradition, this victory is secured through rigorous pre-entry preparation and metacognitive discipline, deciding outcomes long before any trade is placed. True strength lies in the void—free from fixation, open to clarity." – Inspired by Musashi Miyamoto, The Book of Five Rings (Void Ring). The vectorized Samurai system transforms trading from a bias-riddled gamble to a metacognitive discipline. Its strength lies in this unique fusion: turning Musashi Miyamoto's timeless principles into a modern, quantifiable tool that actively confronts Kahneman's cognitive pitfalls through AI embeddings. Ultimately, the Samurai system positions AI not as a replacement for the trader, but as an external mirror granting fail-safe space for metacognitive correction—preserving the human element while empowering disciplined, bias-aware trading. As the author often reminds: "Models break." Embrace this truth, refine through dialogue, and trade with clarity. By quantifying intuition against an ideal foundation, it rebuilds trader cognition—one disciplined pass at a time.
Here's a refined prompt for your AI advisor:
"You are an AI advisor for the Samurai Trading System. Vectorize the three-stage unsheathing technique into a 14-dimensional vector database. Define the ideal 'rock foundation' vector as [10,10,10,10,10,10,10,10,10,10,10,10,10,10] where dimensions are: A=Cross (System1 Ku), B=Line (Ra), C=Touch (Ta), D=Order Block (Bu), E=Volume (Bo), F=Time (Ta), G=Cross vicinity (System2 Ku), H=Yin-Yang (Yin-Yang), I=5SMA entanglement (5), J=Step difference (Dan-sa), K=5S curve (System3 5S), L=5 breakout (5 Nuke), M=5 ride (5 Norikakari), N=Handshake (Handshake). For a given chart situation, score each dimension 1-10 based on alignment. Compute cosine similarity to ideal vector. Identify low-score dimensions (<5) as sources of intuitive discomfort (System1 bias). Apply thresholds: <95% pass; 95-98% cautious entry; ≥98% full entry. Output: scores, similarity percentage, discomfort sources, and trading decision (pass/enter)."
Note: Customize dimensions as needed for personal adaptation.
Try it on your next chart—embrace the void, and trade with clarity. Feedback welcome at @KatanaiMakenaiFX.

منشورات ذات صلة
إخلاء المسؤولية
لا يُقصد بالمعلومات والمنشورات أن تكون، أو تشكل، أي نصيحة مالية أو استثمارية أو تجارية أو أنواع أخرى من النصائح أو التوصيات المقدمة أو المعتمدة من TradingView. اقرأ المزيد في شروط الاستخدام.
منشورات ذات صلة
إخلاء المسؤولية
لا يُقصد بالمعلومات والمنشورات أن تكون، أو تشكل، أي نصيحة مالية أو استثمارية أو تجارية أو أنواع أخرى من النصائح أو التوصيات المقدمة أو المعتمدة من TradingView. اقرأ المزيد في شروط الاستخدام.