

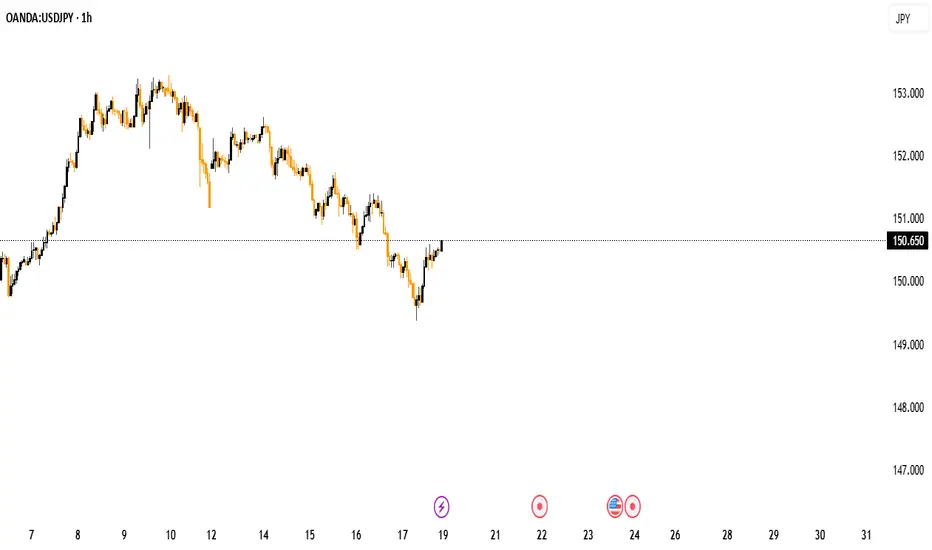
Pair: USD/JPY
Timeframe: M30
Pattern: Falling Channel (Breakout Setup)
Directional Bias: Bullish (Buy Setup)
---
🔍 Technical Analysis
1. Descending Channel:
The price has been moving within a falling channel (marked in blue).
Recently, it broke above the upper trendline — a strong signal of trend reversal from bearish to bullish.
2. Retest Zone (Entry Zone):
The highlighted blue box near 149.817 – 149.333 represents a retest or demand zone.
After breakout, price often returns to this zone to gather liquidity before pushing upward.
This is an ideal entry point for buyers.
3. Structure Formation:
The “W” pattern shown indicates potential double-bottom support confirmation.
That suggests buying pressure building in the zone.
4. Momentum & Trend Shift:
Breakout candle shows strong bullish momentum with solid volume (price closing above the channel).
If price sustains above 149.817 after retest, expect continuation toward next resistance levels.
---
🎯 Trade Plan
Parameter Level Notes
Entry Point 149.817 – 149.600 Wait for bullish confirmation at retest
Stop Loss 149.333 Below the demand zone and structural low
Target Point (TP) 151.130 Based on previous structure resistance
Risk-Reward Ratio (RRR) ≈ 1:3 Strong setup for intraday swing
---
⚙ Confirmation Signals to Watch
Bullish engulfing or pin bar candle at entry zone ✅
RSI > 50 or MACD bullish crossover ✅
Rejection wicks forming at support ✅
---
📈 Summary
This chart shows a bullish breakout with a planned retest, making it a high-probability buy setup.
If price retests the 149.8–149.3 zone and shows bullish confirmation, entry is valid with a target near 151.1.
Keep stops tight and monitor for rejection candles near the entry zone.
Timeframe: M30
Pattern: Falling Channel (Breakout Setup)
Directional Bias: Bullish (Buy Setup)
---
🔍 Technical Analysis
1. Descending Channel:
The price has been moving within a falling channel (marked in blue).
Recently, it broke above the upper trendline — a strong signal of trend reversal from bearish to bullish.
2. Retest Zone (Entry Zone):
The highlighted blue box near 149.817 – 149.333 represents a retest or demand zone.
After breakout, price often returns to this zone to gather liquidity before pushing upward.
This is an ideal entry point for buyers.
3. Structure Formation:
The “W” pattern shown indicates potential double-bottom support confirmation.
That suggests buying pressure building in the zone.
4. Momentum & Trend Shift:
Breakout candle shows strong bullish momentum with solid volume (price closing above the channel).
If price sustains above 149.817 after retest, expect continuation toward next resistance levels.
---
🎯 Trade Plan
Parameter Level Notes
Entry Point 149.817 – 149.600 Wait for bullish confirmation at retest
Stop Loss 149.333 Below the demand zone and structural low
Target Point (TP) 151.130 Based on previous structure resistance
Risk-Reward Ratio (RRR) ≈ 1:3 Strong setup for intraday swing
---
⚙ Confirmation Signals to Watch
Bullish engulfing or pin bar candle at entry zone ✅
RSI > 50 or MACD bullish crossover ✅
Rejection wicks forming at support ✅
---
📈 Summary
This chart shows a bullish breakout with a planned retest, making it a high-probability buy setup.
If price retests the 149.8–149.3 zone and shows bullish confirmation, entry is valid with a target near 151.1.
Keep stops tight and monitor for rejection candles near the entry zone.

join my telegram channel t.me/smartforexacademy45 t.me/smartforexacademy45
JOIN MY REFREL BROKER LINK one.exnessonelink.com/a/gissbq1h9c?source=app
JOIN MY REFREL BROKER LINK one.exnessonelink.com/a/gissbq1h9c?source=app
إخلاء المسؤولية
لا يُقصد بالمعلومات والمنشورات أن تكون، أو تشكل، أي نصيحة مالية أو استثمارية أو تجارية أو أنواع أخرى من النصائح أو التوصيات المقدمة أو المعتمدة من TradingView. اقرأ المزيد في شروط الاستخدام.
join my telegram channel t.me/smartforexacademy45 t.me/smartforexacademy45
JOIN MY REFREL BROKER LINK one.exnessonelink.com/a/gissbq1h9c?source=app
JOIN MY REFREL BROKER LINK one.exnessonelink.com/a/gissbq1h9c?source=app
إخلاء المسؤولية
لا يُقصد بالمعلومات والمنشورات أن تكون، أو تشكل، أي نصيحة مالية أو استثمارية أو تجارية أو أنواع أخرى من النصائح أو التوصيات المقدمة أو المعتمدة من TradingView. اقرأ المزيد في شروط الاستخدام.