
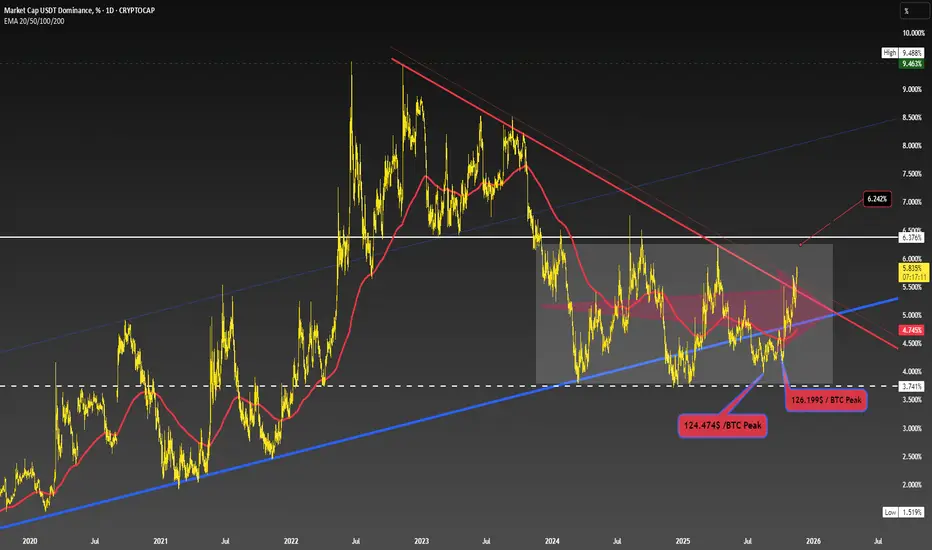
You can clearly see a descending structure here, but the sideways movement between 3.74% and 6.37% is also quite notable. The 6.24% level stands out as the first key resistance target.
If 6.24% fails to break and hold above, a pullback may occur.
So this region is crucial for determining whether USDT Dominance will continue higher or reject and reverse.
Also, the 6.24% level in USDT.D corresponds approximately to a $90,500 BTC price, making this zone even more important to watch.
If 6.24% fails to break and hold above, a pullback may occur.
So this region is crucial for determining whether USDT Dominance will continue higher or reject and reverse.
Also, the 6.24% level in USDT.D corresponds approximately to a $90,500 BTC price, making this zone even more important to watch.
ملاحظة
This is not financial advice.
منشورات ذات صلة
إخلاء المسؤولية
لا يُقصد بالمعلومات والمنشورات أن تكون، أو تشكل، أي نصيحة مالية أو استثمارية أو تجارية أو أنواع أخرى من النصائح أو التوصيات المقدمة أو المعتمدة من TradingView. اقرأ المزيد في شروط الاستخدام.
منشورات ذات صلة
إخلاء المسؤولية
لا يُقصد بالمعلومات والمنشورات أن تكون، أو تشكل، أي نصيحة مالية أو استثمارية أو تجارية أو أنواع أخرى من النصائح أو التوصيات المقدمة أو المعتمدة من TradingView. اقرأ المزيد في شروط الاستخدام.