
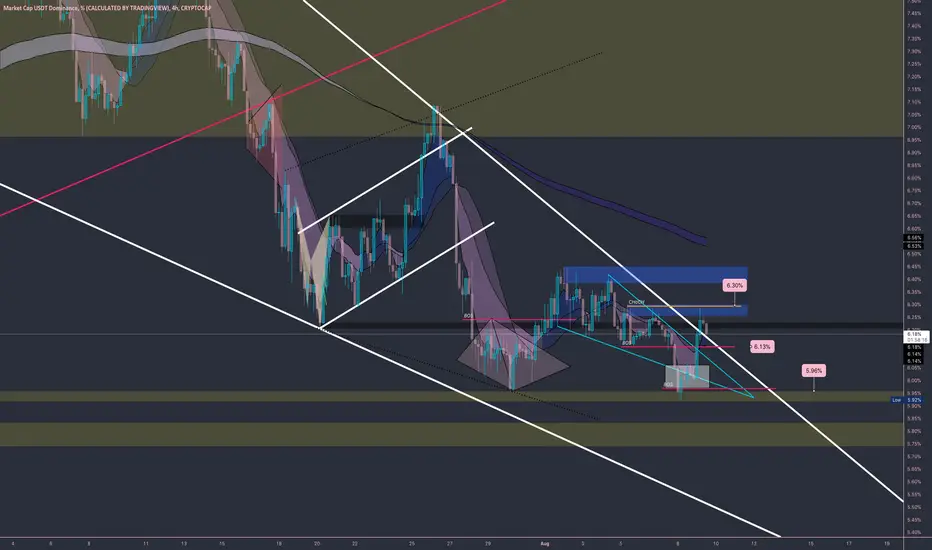
AUG 9th USDT.D analysis
5.96 was a big measured move from the previous bear flag and we can see 2 consolidations for a double bottom bounce. Big daily/weekly wedge to watch still especially with CPI data which will affect all markets likely tomorrow.
It went sideways long enough after the bear flag break towards the right side and wedge resistance even though we are seeing lower highs on the bigger swing. A backtest here of the breakout.
Much like the VIX, you can argue that it's not something you chart but you can compare the movement and see there is a large inverse relationship between this and BTC. Use it as a tool to supplement your other analysis!
5.96 was a big measured move from the previous bear flag and we can see 2 consolidations for a double bottom bounce. Big daily/weekly wedge to watch still especially with CPI data which will affect all markets likely tomorrow.
It went sideways long enough after the bear flag break towards the right side and wedge resistance even though we are seeing lower highs on the bigger swing. A backtest here of the breakout.
Much like the VIX, you can argue that it's not something you chart but you can compare the movement and see there is a large inverse relationship between this and BTC. Use it as a tool to supplement your other analysis!
ملاحظة
Actually didn't even realize until posted yesterday, nice bearish butterfly. At target #2 5.92 now, wicks into that level and also a demand zone. Time will tell how this retraces or continuation down towards bigger target.ملاحظة
Zones and zones. Self explanatory, tests and retests.ملاحظة
Broke out of the massive wedge, now watching for right shoulder to be valid if supply reacts or invalidated if it breaks through. Either way if time repeats it could take 30 days to see this consolidation. Expect volatility and range.7.09 weekly supply.
ملاحظة
4hr - outside of diamond, right in between a weekly supply up top and demand below. USDT.D 
إخلاء المسؤولية
لا يُقصد بالمعلومات والمنشورات أن تكون، أو تشكل، أي نصيحة مالية أو استثمارية أو تجارية أو أنواع أخرى من النصائح أو التوصيات المقدمة أو المعتمدة من TradingView. اقرأ المزيد في شروط الاستخدام.
إخلاء المسؤولية
لا يُقصد بالمعلومات والمنشورات أن تكون، أو تشكل، أي نصيحة مالية أو استثمارية أو تجارية أو أنواع أخرى من النصائح أو التوصيات المقدمة أو المعتمدة من TradingView. اقرأ المزيد في شروط الاستخدام.