
US CPI
US Headline and Core CPI for October both came in lower than expected (decrease).
US Headline CPI:
US Core CPI:
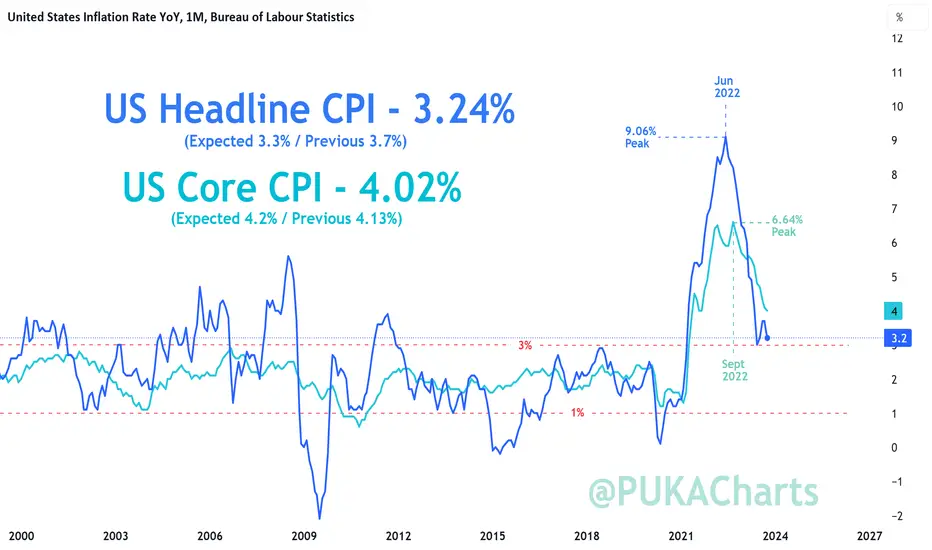
The chart below illustrates the direction of the current YoY down trend for both Headline and Core CPI however we are still not at the historical moderate levels of inflation desired. You can see these moderate levels of inflation between 1 – 3% from 2002 – 2020 below.
Nice to see the Core CPI come down, almost down, into the moderate historical averages
PUKA
US Headline and Core CPI for October both came in lower than expected (decrease).
US Headline CPI:
- YoY – Actual 3.24% / Exp. 3.3% / Prev. 3.7% (Green on cha
US Core CPI:
- YoY – Actual 4.02% / Exp. 4.2% / Prev. 4.13% (Blue on chart)
The chart below illustrates the direction of the current YoY down trend for both Headline and Core CPI however we are still not at the historical moderate levels of inflation desired. You can see these moderate levels of inflation between 1 – 3% from 2002 – 2020 below.
Nice to see the Core CPI come down, almost down, into the moderate historical averages
PUKA

منشورات ذات صلة
إخلاء المسؤولية
لا يُقصد بالمعلومات والمنشورات أن تكون، أو تشكل، أي نصيحة مالية أو استثمارية أو تجارية أو أنواع أخرى من النصائح أو التوصيات المقدمة أو المعتمدة من TradingView. اقرأ المزيد في شروط الاستخدام.
منشورات ذات صلة
إخلاء المسؤولية
لا يُقصد بالمعلومات والمنشورات أن تكون، أو تشكل، أي نصيحة مالية أو استثمارية أو تجارية أو أنواع أخرى من النصائح أو التوصيات المقدمة أو المعتمدة من TradingView. اقرأ المزيد في شروط الاستخدام.