
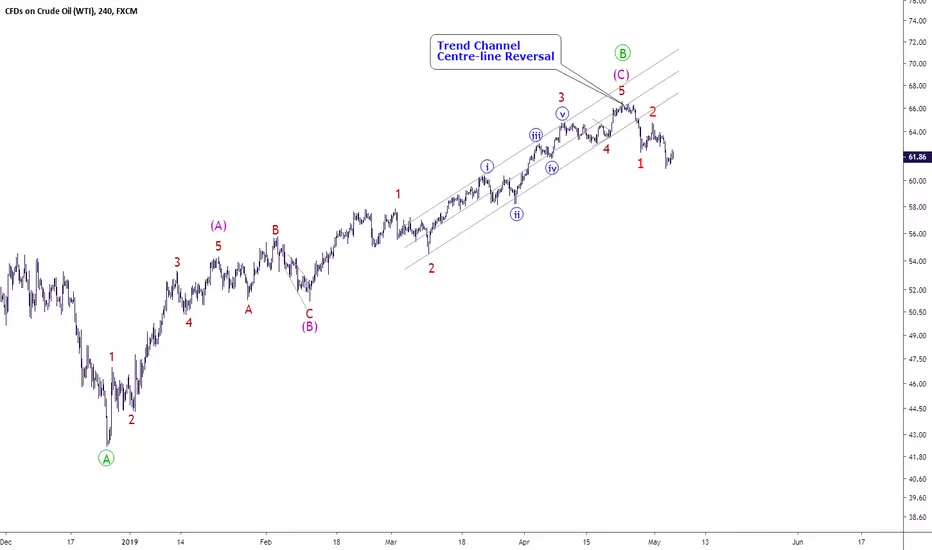
It might be bit early to call the end of bullish rally since late December 2018. But we could certainly have a count that shows wave (C) of {B} has reached it's peak.
ملاحظة
But the above count does not necessarily mean the start of the multi months bear market, here is an alternative countملاحظة
possible Long-term wave countملاحظة
Divergence between RSI & Price, but price is still trading above the blue up trend line
ملاحظة
short-term countملاحظة
any push above 64.72 would argue either wave 4 or wave 5 is under wayملاحظة
ملاحظة
break below the blue wave {i} low at 60.04 would indicate wave {iii} decline is under wayملاحظة
there are two possible bearish counts: either 1-2 or 1-2 plus {i}-{ii}ملاحظة
ملاحظة
The '1-2' scenario also has two possible counts flat {b} of 2
triangle {b} of 2
ملاحظة
break below 62.09 ( end of wave (i) of {c} of 2) would indicate blue wave {c} is doneملاحظة
The '1-2 plus {i}-{ii}' scenario ملاحظة
ملاحظة
also notice that price has failed number of times to climb back above the uptrend lineملاحظة
Therefore I think it's less likely to see another wave 5 of (C). A solid close below $60.02 (6 May low) would confirm the above bearish counts.ملاحظة
is wave 3 ready to explode?
ملاحظة
Short-term countملاحظة
daily chartملاحظة
we could also assume the 1-2 is one degree higher and count the structure as followsملاحظة
ملاحظة
possible short-term counts:either
or
ملاحظة
ملاحظة
alternative countملاحظة
ملاحظة
wave {iv} under way?
ملاحظة
ملاحظة
wave (iv) could be a triangleملاحظة
ملاحظة
possible short-term counts:wave 3 done ( or if 1-2 = (1)-(2), then 3 = 1 of (3) )
ملاحظة
or wave (i)-(ii) of {v} ملاحظة
immediate break above end of wave {iv} at $53.36 would eliminate the above (i)-(ii) scenarioملاحظة
ملاحظة
wave 4 or wave 2 of (3)ملاحظة
ملاحظة
triangle or flat?
ملاحظة
triangleor flat
ملاحظة
ملاحظة
{a}-{b}-{c} flat with a diagonal wave {c}?ملاحظة
ملاحظة
or an impulse wave {c}ملاحظة
ملاحظة
possible short-term countملاحظة
possible short-term countملاحظة
either way ملاحظة
ملاحظة
let's see if guppy ema could trigger the bearish signalملاحظة
a solid close below wave (iv) low at $57.73 would also argue wave 2 has reached it's peakملاحظة
ملاحظة
break below wave {a}(of 2) high at $54.80 would confirm the above bearish countملاحظة
possible short-term countملاحظة
key resistance at $58.32 as wave iv should not breach the end of wave iملاحظة
possible short-term countsor
ملاحظة
note the rally from recent low at 56.03 is contained within a parallel channelملاحظة
triple zigzag?
ملاحظة
ملاحظة
Need to see an impulsive decline to break below the end of wave x at 57.30ملاحظة
ملاحظة
alternative countملاحظة
possible short-term countملاحظة
possible short-term countملاحظة
ملاحظة
either pink A-B-C complete (Y) or grey (1)-(2) then {i}-{ii}ملاحظة
ملاحظة
Note on 11 July, i assumed the following two scenarios:Bullish A-B-C for wave (Y)
Bearish (1)-(2)
ملاحظة
the bullish count is no longer valid, simply because wave B of a zigzag can never move beyond the start of wave Aملاحظة
ملاحظة
possible short term countsملاحظة
bearish green {i}-{ii}-(i)-(ii)OR
bullish grey A-B-C flat for wave (2)
ملاحظة
ملاحظة
ملاحظة
ملاحظة
no changeملاحظة
Complex flat for wave (2)Simple flat for wave (2)
ملاحظة
OR even a more complex correction for wave (2) , e.g. double three combination where wave Y is a triangleملاحظة
Flat or Combination
ملاحظة
there are some bullish possibilitiesor
ملاحظة
medium term expectationsOR

'When you have eliminated the impossible, whatever remains, however improbable must be the truth.'
Email:info@ewc.space
Email:info@ewc.space
منشورات ذات صلة
إخلاء المسؤولية
لا يُقصد بالمعلومات والمنشورات أن تكون، أو تشكل، أي نصيحة مالية أو استثمارية أو تجارية أو أنواع أخرى من النصائح أو التوصيات المقدمة أو المعتمدة من TradingView. اقرأ المزيد في شروط الاستخدام.
'When you have eliminated the impossible, whatever remains, however improbable must be the truth.'
Email:info@ewc.space
Email:info@ewc.space
منشورات ذات صلة
إخلاء المسؤولية
لا يُقصد بالمعلومات والمنشورات أن تكون، أو تشكل، أي نصيحة مالية أو استثمارية أو تجارية أو أنواع أخرى من النصائح أو التوصيات المقدمة أو المعتمدة من TradingView. اقرأ المزيد في شروط الاستخدام.