
WTI's Lower Highs Keep Winning. Can Higher Lows Save the Trend?
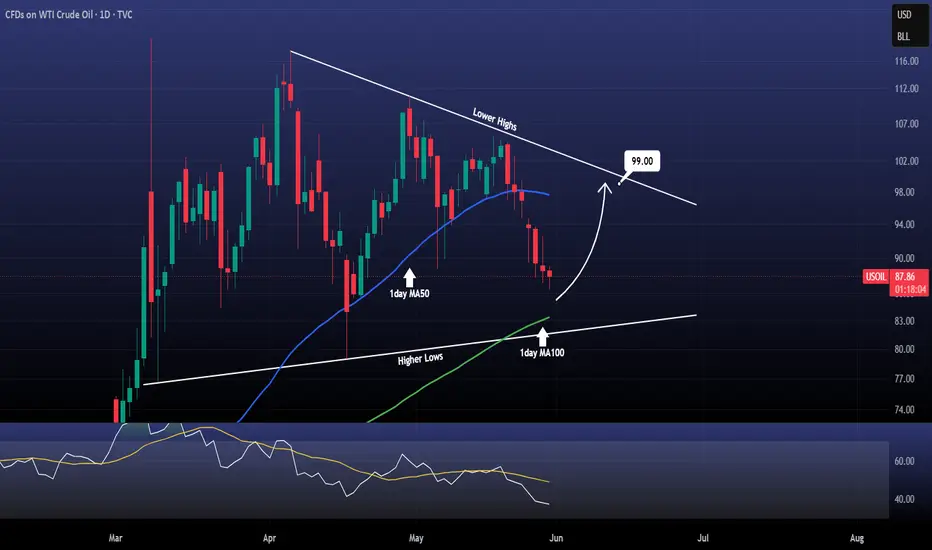
Oil is approaching one of the most important moments in its recent structure.
Not because a breakout has happened.
Not because a breakdown has happened.
But because the market is now trapped between two opposing forces:
Lower highs above and higher lows below.
Eventually, one side wins.
Trend Structure
The current chart presents a fascinating conflict.
On one side:
• A descending trendline producing lower highs
• Repeated seller reactions from resistance
On the other:
• A rising trendline producing higher lows
• Buyers continuing to defend pullbacks
The result is a tightening structure where both sides continue losing ground.
And that usually doesn't last forever.
Support / Resistance
Visible resistance:
• Descending trendline resistance
• Area near the projected 99.00 level
Visible support:
• Rising trendline support
• 1 Day MA100 region
At the moment, price sits closer to support than resistance.
That makes the next reaction particularly interesting.
Moving Averages
Visible MAs:
• 1 Day MA50 ≈ 97.59 (blue)
• 1 Day MA100 ≈ 83.34 (green)
Observations:
• Price currently trades below the MA50
• MA50 is acting as overhead resistance
• MA100 continues rising beneath price
This creates a mixed technical picture.
Short-term weakness.
Longer-term support.
Indicators Visible
RSI(14):
Current RSI:
≈ 37
Observations:
• RSI remains below its signal line
• Momentum continues deteriorating
• No strong bullish momentum recovery visible
Momentum currently favors caution.
Chart Pattern
Primary visible structure:
Converging Trendlines
The chart highlights:
• Lower highs
• Higher lows
This creates an increasingly compressed environment.
Compression phases often precede expansion phases.
The only uncertainty is direction.
Bullish Scenario
For buyers:
• Rising support continues holding
• Price stabilizes near current levels
• Recovery toward descending resistance develops
The chart's bullish projection points toward:
99.00
That level represents the next visible resistance objective.
Bearish Scenario
For sellers:
• Lower-high structure remains dominant
• RSI weakness persists
• Rising support eventually fails
A break of support would strengthen the bearish trend currently visible through the descending resistance line.
For now, however:
Support has not broken.
One interesting observation:
Markets often become most difficult to trade when both sides have valid arguments.
Bulls can point to higher lows.
Bears can point to lower highs.
The chart currently supports both.
Which means the next move may matter more than any opinion.
Do you think Oil rebounds toward 99.00 from support — or do the lower highs eventually force a breakdown?
Not because a breakout has happened.
Not because a breakdown has happened.
But because the market is now trapped between two opposing forces:
Lower highs above and higher lows below.
Eventually, one side wins.
Trend Structure
The current chart presents a fascinating conflict.
On one side:
• A descending trendline producing lower highs
• Repeated seller reactions from resistance
On the other:
• A rising trendline producing higher lows
• Buyers continuing to defend pullbacks
The result is a tightening structure where both sides continue losing ground.
And that usually doesn't last forever.
Support / Resistance
Visible resistance:
• Descending trendline resistance
• Area near the projected 99.00 level
Visible support:
• Rising trendline support
• 1 Day MA100 region
At the moment, price sits closer to support than resistance.
That makes the next reaction particularly interesting.
Moving Averages
Visible MAs:
• 1 Day MA50 ≈ 97.59 (blue)
• 1 Day MA100 ≈ 83.34 (green)
Observations:
• Price currently trades below the MA50
• MA50 is acting as overhead resistance
• MA100 continues rising beneath price
This creates a mixed technical picture.
Short-term weakness.
Longer-term support.
Indicators Visible
RSI(14):
Current RSI:
≈ 37
Observations:
• RSI remains below its signal line
• Momentum continues deteriorating
• No strong bullish momentum recovery visible
Momentum currently favors caution.
Chart Pattern
Primary visible structure:
Converging Trendlines
The chart highlights:
• Lower highs
• Higher lows
This creates an increasingly compressed environment.
Compression phases often precede expansion phases.
The only uncertainty is direction.
Bullish Scenario
For buyers:
• Rising support continues holding
• Price stabilizes near current levels
• Recovery toward descending resistance develops
The chart's bullish projection points toward:
99.00
That level represents the next visible resistance objective.
Bearish Scenario
For sellers:
• Lower-high structure remains dominant
• RSI weakness persists
• Rising support eventually fails
A break of support would strengthen the bearish trend currently visible through the descending resistance line.
For now, however:
Support has not broken.
One interesting observation:
Markets often become most difficult to trade when both sides have valid arguments.
Bulls can point to higher lows.
Bears can point to lower highs.
The chart currently supports both.
Which means the next move may matter more than any opinion.
Do you think Oil rebounds toward 99.00 from support — or do the lower highs eventually force a breakdown?

thecryptagon.com covers news & insights on global markets (crypto, forex, stocks, commodities)
Institutional services offered:
💰 Daily consulting
💰 Account management
💰 Mentorship
Contact: t.me/thecryptagon | info@thecryptagon.com
Institutional services offered:
💰 Daily consulting
💰 Account management
💰 Mentorship
Contact: t.me/thecryptagon | info@thecryptagon.com
إخلاء المسؤولية
لا يُقصد بالمعلومات والمنشورات أن تكون، أو تشكل، أي نصيحة مالية أو استثمارية أو تجارية أو أنواع أخرى من النصائح أو التوصيات المقدمة أو المعتمدة من TradingView. اقرأ المزيد في شروط الاستخدام.
thecryptagon.com covers news & insights on global markets (crypto, forex, stocks, commodities)
Institutional services offered:
💰 Daily consulting
💰 Account management
💰 Mentorship
Contact: t.me/thecryptagon | info@thecryptagon.com
Institutional services offered:
💰 Daily consulting
💰 Account management
💰 Mentorship
Contact: t.me/thecryptagon | info@thecryptagon.com
إخلاء المسؤولية
لا يُقصد بالمعلومات والمنشورات أن تكون، أو تشكل، أي نصيحة مالية أو استثمارية أو تجارية أو أنواع أخرى من النصائح أو التوصيات المقدمة أو المعتمدة من TradingView. اقرأ المزيد في شروط الاستخدام.