
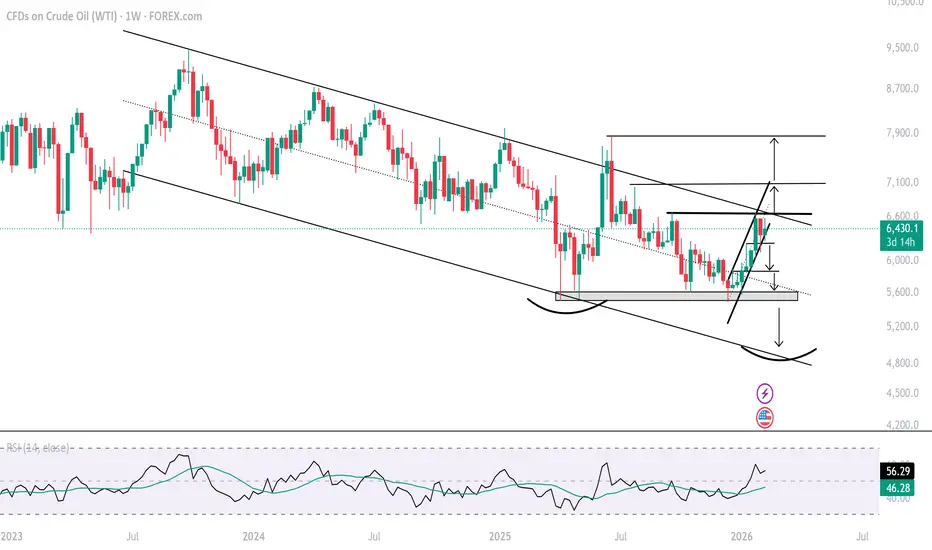
From a weekly perspective, WTI prices can be seen respecting an up-trending and parallel channel since the lows of 2025, holding a bullish bias for price action across 2026. The latest correction from the 66.50 high coincides with the upper bound of the Dec–Feb channel, and the upper bound of a down-trending channel since Sep 2023, creating a critical resistance zone that can open the way towards a steeper breakthrough in crude prices to the 70s zone, eyeing key levels at 69, 70.40, 74.40, and 80 respectively, defined using the Fibonacci extension tool between the lows of April 2025, the highs of June 2025, and the lows of December 2025.
A short-term resistance level identified on the daily chart before reclaiming the 66 mark is 65. On the downside, a breakdown below the bounds of the channel, below 62.20, can open the path to levels that can still be considered on the bullish end between 61.23 and 60.20. A bearish bias is expected to reassert itself below the 60 mark, targeting 58.70, 56.30, 55, and 49, a level that aligns with the lower bound of the respected channel.
- Razan Hilal
A short-term resistance level identified on the daily chart before reclaiming the 66 mark is 65. On the downside, a breakdown below the bounds of the channel, below 62.20, can open the path to levels that can still be considered on the bullish end between 61.23 and 60.20. A bearish bias is expected to reassert itself below the 60 mark, targeting 58.70, 56.30, 55, and 49, a level that aligns with the lower bound of the respected channel.
- Razan Hilal

إخلاء المسؤولية
لا يُقصد بالمعلومات والمنشورات أن تكون، أو تشكل، أي نصيحة مالية أو استثمارية أو تجارية أو أنواع أخرى من النصائح أو التوصيات المقدمة أو المعتمدة من TradingView. اقرأ المزيد في شروط الاستخدام.
إخلاء المسؤولية
لا يُقصد بالمعلومات والمنشورات أن تكون، أو تشكل، أي نصيحة مالية أو استثمارية أو تجارية أو أنواع أخرى من النصائح أو التوصيات المقدمة أو المعتمدة من TradingView. اقرأ المزيد في شروط الاستخدام.