تم تحديثه
VAL - Sora Validator Token
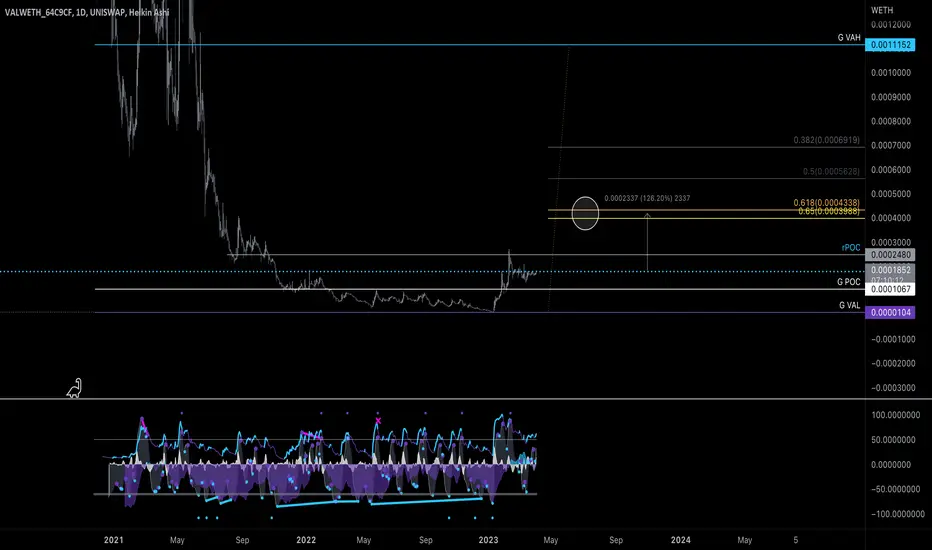
This chart is a creative venture. I did something a little different. I pulled a volume profile for the entire uniswap history of VAL token. I then pulled a FIB range on that revealed VAH and VAL area (value area high, low).
It is creative in the sense that I want to see if the total buying and selling data from the volume profile will be respected in the future with external market conditions. It all plays together but so do the minor details.
So it's a bit predictive in nature but no guarantees, and no fortune telling.
I will make other charts on VAL but for now I will start here.
It is creative in the sense that I want to see if the total buying and selling data from the volume profile will be respected in the future with external market conditions. It all plays together but so do the minor details.
So it's a bit predictive in nature but no guarantees, and no fortune telling.
I will make other charts on VAL but for now I will start here.
ملاحظة
High Confluence Below us as well ملاحظة
Almost there
***Get 25% off Nami indicators - nami-trading.com/?dt_id=1375915
***CRYPTO TAXES use KOINLY - koinly.io/?via=97548A41&utm_source=affiliate
***JOIN TRADINGVIEW tradingview.com/?aff_id=137
***CRYPTO TAXES use KOINLY - koinly.io/?via=97548A41&utm_source=affiliate
***JOIN TRADINGVIEW tradingview.com/?aff_id=137
إخلاء المسؤولية
لا يُقصد بالمعلومات والمنشورات أن تكون، أو تشكل، أي نصيحة مالية أو استثمارية أو تجارية أو أنواع أخرى من النصائح أو التوصيات المقدمة أو المعتمدة من TradingView. اقرأ المزيد في شروط الاستخدام.
***Get 25% off Nami indicators - nami-trading.com/?dt_id=1375915
***CRYPTO TAXES use KOINLY - koinly.io/?via=97548A41&utm_source=affiliate
***JOIN TRADINGVIEW tradingview.com/?aff_id=137
***CRYPTO TAXES use KOINLY - koinly.io/?via=97548A41&utm_source=affiliate
***JOIN TRADINGVIEW tradingview.com/?aff_id=137
إخلاء المسؤولية
لا يُقصد بالمعلومات والمنشورات أن تكون، أو تشكل، أي نصيحة مالية أو استثمارية أو تجارية أو أنواع أخرى من النصائح أو التوصيات المقدمة أو المعتمدة من TradingView. اقرأ المزيد في شروط الاستخدام.