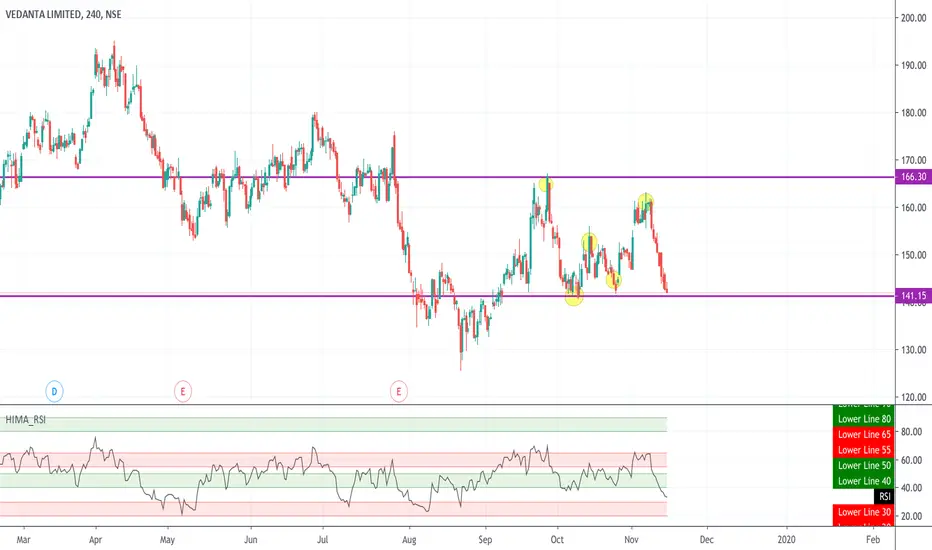
 VEDL on the H4 chart approaching oversold zone on the RSI which is coinciding with the bottom of the sideways channel formation and on the daily charts we can see that is currently in the mid green zone on RSI, price could test 139 levels. Watch out if the price bounces off support , if yes, may go upwards toward the upper channel.
Ideally, don't trade the channel, look for breakouts. These maybe more profitable!
Trying between channels is riskier, know your risk!
If you like what you read, please share a thumbs up and follow for more updates!
Cheers
ملاحظة
Playing well within defined limits
منشورات ذات صلة
إخلاء المسؤولية
لا يُقصد بالمعلومات والمنشورات أن تكون، أو تشكل، أي نصيحة مالية أو استثمارية أو تجارية أو أنواع أخرى من النصائح أو التوصيات المقدمة أو المعتمدة من TradingView. اقرأ المزيد في شروط الاستخدام.
منشورات ذات صلة
إخلاء المسؤولية
لا يُقصد بالمعلومات والمنشورات أن تكون، أو تشكل، أي نصيحة مالية أو استثمارية أو تجارية أو أنواع أخرى من النصائح أو التوصيات المقدمة أو المعتمدة من TradingView. اقرأ المزيد في شروط الاستخدام.