
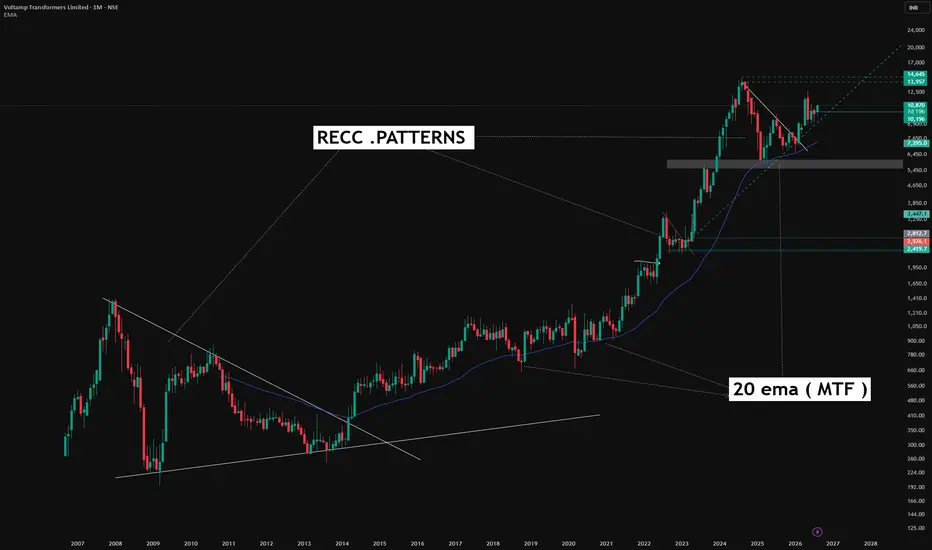
All price action shown in this chart is historical and older than three months. This post is purely educational and observational in nature. It is not a forecast or a trading recommendation.
The First Instance: 2008 to 2014
Between 2008 and 2014, this stock formed a symmetrical triangle pattern on the monthly timeframe. The eventual breakout in 2014 coincided with price reclaiming the 50 day exponential moving average on the same timeframe, with the triangle breakout and the EMA reclaim occurring together.
The Pattern Returns: 2022
Following a substantial rally in the years after, a strikingly similar symmetrical triangle structure formed again in 2022. Once again, this consolidation appeared after an extended upmove, echoing the same setup that had played out roughly a decade earlier.
The Pattern Returns Again: 2024
The same sequence repeated once more in 2024, a symmetrical triangle breakout aligning again with support being taken at the 50 day exponential moving average on the monthly timeframe. Three separate instances, years apart, each showing the same structural fingerprint.
The Bigger Observation
This chart is not about predicting whether the same outcome will occur a fourth time. It is about recognizing something more fundamental, that while history as a specific outcome may never truly repeat itself, the patterns and structures the market tends to form clearly do recur. The same triangle formation, the same moving average interaction, showing up across three distinct periods on the same chart, is a reminder that price action often rhymes even when the underlying story around it is completely different each time.
The First Instance: 2008 to 2014
Between 2008 and 2014, this stock formed a symmetrical triangle pattern on the monthly timeframe. The eventual breakout in 2014 coincided with price reclaiming the 50 day exponential moving average on the same timeframe, with the triangle breakout and the EMA reclaim occurring together.
The Pattern Returns: 2022
Following a substantial rally in the years after, a strikingly similar symmetrical triangle structure formed again in 2022. Once again, this consolidation appeared after an extended upmove, echoing the same setup that had played out roughly a decade earlier.
The Pattern Returns Again: 2024
The same sequence repeated once more in 2024, a symmetrical triangle breakout aligning again with support being taken at the 50 day exponential moving average on the monthly timeframe. Three separate instances, years apart, each showing the same structural fingerprint.
The Bigger Observation
This chart is not about predicting whether the same outcome will occur a fourth time. It is about recognizing something more fundamental, that while history as a specific outcome may never truly repeat itself, the patterns and structures the market tends to form clearly do recur. The same triangle formation, the same moving average interaction, showing up across three distinct periods on the same chart, is a reminder that price action often rhymes even when the underlying story around it is completely different each time.

📊Swing & positional research with Buy, Sell & Hold recommendations
Contact for NOVEMBER SLOTS
📞WhatsApp ( Pro ): wa.me/919455664601
📢Free Picks on Telegram ( Join ) : t.me/hashtaghammer
Apoorv Dubey|SEBI RA INH000030287
Contact for NOVEMBER SLOTS
📞WhatsApp ( Pro ): wa.me/919455664601
📢Free Picks on Telegram ( Join ) : t.me/hashtaghammer
Apoorv Dubey|SEBI RA INH000030287
منشورات ذات صلة
إخلاء المسؤولية
لا يُقصد بالمعلومات والمنشورات أن تكون، أو تشكل، أي نصيحة مالية أو استثمارية أو تجارية أو أنواع أخرى من النصائح أو التوصيات المقدمة أو المعتمدة من TradingView. اقرأ المزيد في شروط الاستخدام.
📊Swing & positional research with Buy, Sell & Hold recommendations
Contact for NOVEMBER SLOTS
📞WhatsApp ( Pro ): wa.me/919455664601
📢Free Picks on Telegram ( Join ) : t.me/hashtaghammer
Apoorv Dubey|SEBI RA INH000030287
Contact for NOVEMBER SLOTS
📞WhatsApp ( Pro ): wa.me/919455664601
📢Free Picks on Telegram ( Join ) : t.me/hashtaghammer
Apoorv Dubey|SEBI RA INH000030287
منشورات ذات صلة
إخلاء المسؤولية
لا يُقصد بالمعلومات والمنشورات أن تكون، أو تشكل، أي نصيحة مالية أو استثمارية أو تجارية أو أنواع أخرى من النصائح أو التوصيات المقدمة أو المعتمدة من TradingView. اقرأ المزيد في شروط الاستخدام.