
Hey all,
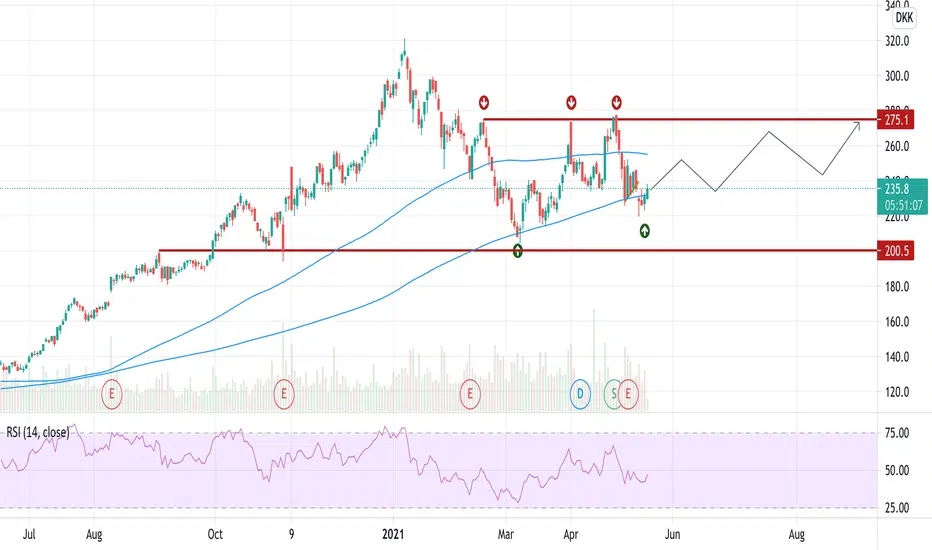
Since recovering from it's multi-month sell off, Vestas found strong support in early March at the 200-day MA, and has since been consolidating within a moving average "trap zone".
I have observed this pattern previously and on daily time frames, this sort of "coiling" will bring to a strong move up or down once the trap narrows, RSI seems to be developing a wedge pattern also, needing to chose a direction for the months to come.
VWS is currently trading below the 20, 50 and 100-day moving average, but has found support again at the 200-day MA recently.
I like this set up, although I would preferably be watching for a breakout above 275DKK for confirmation.
Downside risk is probably around the 200DKK mark.
Any thoughts?
Good luck!
(*This is not financial advice, for sake of discussion and illustrative purposes only*)

إخلاء المسؤولية
لا يُقصد بالمعلومات والمنشورات أن تكون، أو تشكل، أي نصيحة مالية أو استثمارية أو تجارية أو أنواع أخرى من النصائح أو التوصيات المقدمة أو المعتمدة من TradingView. اقرأ المزيد في شروط الاستخدام.
إخلاء المسؤولية
لا يُقصد بالمعلومات والمنشورات أن تكون، أو تشكل، أي نصيحة مالية أو استثمارية أو تجارية أو أنواع أخرى من النصائح أو التوصيات المقدمة أو المعتمدة من TradingView. اقرأ المزيد في شروط الاستخدام.