
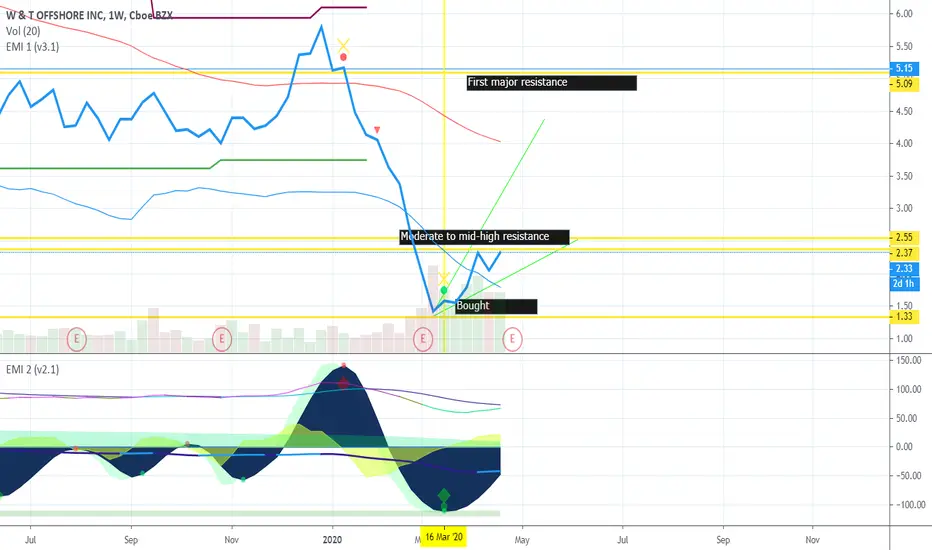
Here is a more in depth analysis of yesterday's published idea. WTI has appeared to have confirmed a new bottom with the EMI after closing repeatedly above bottom support (scripting thanks to bonic) signaling a heavy buy signal on the weekly and monthly charts. We have to manage risk here. I have place a strong watch on the bottom uptrend support around 1.8 up to potentially 2.5 and so on. Stop loss should be used accordingly how low depending on how much you are willing to risk. Though that should be pretty clear if you stay up to date on analysis. immediate resistance but according to EMI appears likely to break through both 2.37-.39 and 2.55-6 resistance lines. If it fails to do so you may consider selling to play safe. Read the charts.
bounce off long term support

same bounce with a more current date range

bounce off long term support
same bounce with a more current date range
تم فتح الصفقة
IT has closed aboe 2.55 nice and is using it as support as of now. If i starts to move up next resistance is around 3.5تم فتح الصفقة
Continuing upward movement. All indicators still at buy
إخلاء المسؤولية
لا يُقصد بالمعلومات والمنشورات أن تكون، أو تشكل، أي نصيحة مالية أو استثمارية أو تجارية أو أنواع أخرى من النصائح أو التوصيات المقدمة أو المعتمدة من TradingView. اقرأ المزيد في شروط الاستخدام.
إخلاء المسؤولية
لا يُقصد بالمعلومات والمنشورات أن تكون، أو تشكل، أي نصيحة مالية أو استثمارية أو تجارية أو أنواع أخرى من النصائح أو التوصيات المقدمة أو المعتمدة من TradingView. اقرأ المزيد في شروط الاستخدام.