
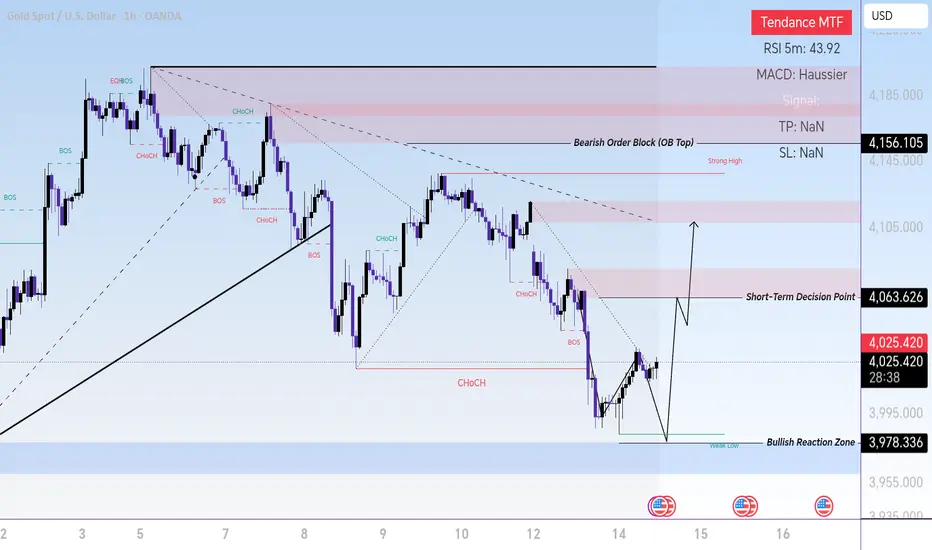
This XAU/USD (Gold) 1H chart presents a complete Smart Money Concept (SMC) market structure analysis, explaining how every candle reflects the battle between buyers and sellers, liquidity movement, and institutional order flow.
The chart begins with a bullish phase where price creates higher highs and higher lows, showing buyer strength. As price reaches the upper liquidity area, EQH (Equal Highs) and Strong High formation indicate a potential liquidity pool where smart money may target resting orders.
After reaching the premium zone, sellers gain control and price starts forming lower highs and lower lows. Multiple BOS (Break of Structure) signals confirm bearish continuation, while CHoCH (Change of Character) highlights the shift from bullish momentum into a bearish structure.
Each candle around the supply area shows rejection and selling pressure, indicating institutional distribution. The descending movement confirms that sellers are defending higher price levels and pushing price toward lower liquidity zones.
The recent decline moves toward the Weak Low / Liquidity Zone near 3978, where sell-side liquidity is resting. This area can act as a potential reaction zone where smart money may collect liquidity before the next expansion.
The chart also highlights important decision areas:
Strong High: Major liquidity and resistance area
Supply Zone: Area of potential seller activity
CHoCH: Market direction shift confirmation
BOS: Continuation of existing structure
Weak Low: Liquidity target and possible reversal area
Demand Zone: Potential buyer reaction zone
If price successfully sweeps the weak low and shows bullish confirmation, a recovery toward 4063, 4120, and higher resistance zones may develop. However, failure to hold demand could continue the bearish structure.
This analysis is created for educational purposes, showing how professional traders study each candle through liquidity, market structure, order flow, BOS, CHoCH, and supply-demand concepts before making trading decisions.
The chart begins with a bullish phase where price creates higher highs and higher lows, showing buyer strength. As price reaches the upper liquidity area, EQH (Equal Highs) and Strong High formation indicate a potential liquidity pool where smart money may target resting orders.
After reaching the premium zone, sellers gain control and price starts forming lower highs and lower lows. Multiple BOS (Break of Structure) signals confirm bearish continuation, while CHoCH (Change of Character) highlights the shift from bullish momentum into a bearish structure.
Each candle around the supply area shows rejection and selling pressure, indicating institutional distribution. The descending movement confirms that sellers are defending higher price levels and pushing price toward lower liquidity zones.
The recent decline moves toward the Weak Low / Liquidity Zone near 3978, where sell-side liquidity is resting. This area can act as a potential reaction zone where smart money may collect liquidity before the next expansion.
The chart also highlights important decision areas:
Strong High: Major liquidity and resistance area
Supply Zone: Area of potential seller activity
CHoCH: Market direction shift confirmation
BOS: Continuation of existing structure
Weak Low: Liquidity target and possible reversal area
Demand Zone: Potential buyer reaction zone
If price successfully sweeps the weak low and shows bullish confirmation, a recovery toward 4063, 4120, and higher resistance zones may develop. However, failure to hold demand could continue the bearish structure.
This analysis is created for educational purposes, showing how professional traders study each candle through liquidity, market structure, order flow, BOS, CHoCH, and supply-demand concepts before making trading decisions.
تم فتح الصفقة
Potential Move: 800 Pips TargetPrice structure indicates a possible 800 pips expansion move from the current liquidity zone, targeting higher resistance areas after confirmation of market structure shift.
Note: 800 pips projection is based on price action, liquidity zones, and SMC structure. Proper risk management and confirmation are required before any trade decision.
أغلقت الصفقة: تم الوصول للهدف

منشورات ذات صلة
إخلاء المسؤولية
لا يُقصد بالمعلومات والمنشورات أن تكون، أو تشكل، أي نصيحة مالية أو استثمارية أو تجارية أو أنواع أخرى من النصائح أو التوصيات المقدمة أو المعتمدة من TradingView. اقرأ المزيد في شروط الاستخدام.
منشورات ذات صلة
إخلاء المسؤولية
لا يُقصد بالمعلومات والمنشورات أن تكون، أو تشكل، أي نصيحة مالية أو استثمارية أو تجارية أو أنواع أخرى من النصائح أو التوصيات المقدمة أو المعتمدة من TradingView. اقرأ المزيد في شروط الاستخدام.