
📊 Market Brief
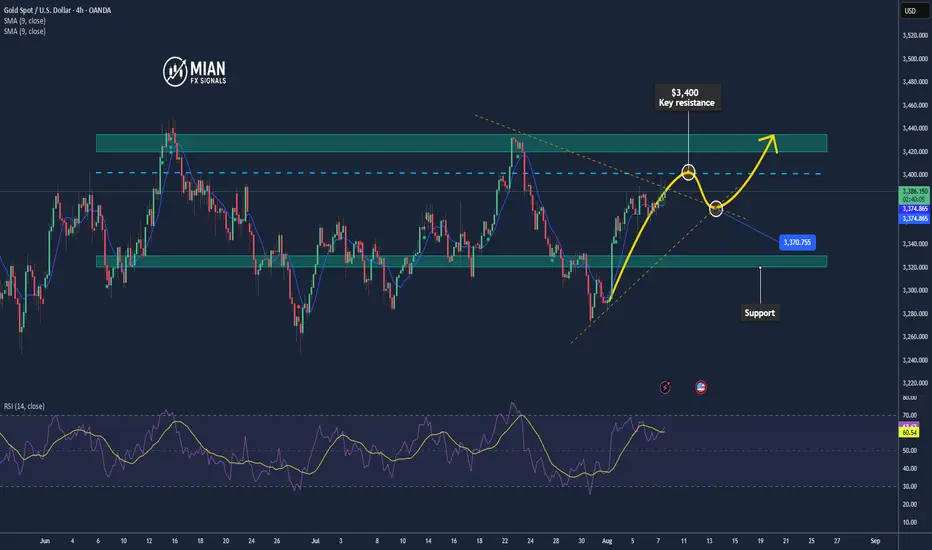
Gold prices remain firm above the 20-day EMA and 50-day MA, reflecting increased safe-haven demand amid ongoing trade tensions and growing expectations of a Fed rate cut.
The price is currently testing the resistance area around $3,400/oz, while immediate support lies in the $3,320–$3,330/oz range.
📉 Technical Analysis
• Key Resistance:
- $3,400
- Followed by: $3,420–$3,435
• Nearest Support:
$3,320–$3,330
- If broken, next levels are $3,300–$3,268
• EMA Position:
- Gold remains above both the 20-day EMA and 50-day MA, indicating a short-term uptrend
• Patterns & Momentum:
- RSI ~54 (neutral), MACD positive – indicating underlying bullish momentum
- EMA 8/21 crossover is turning upward, signaling short-term bullish reversal potential
📌 Outlook
Gold may continue rising modestly if it holds above the $3,320–$3,330 support zone and successfully breaches the $3,400 resistance. However, a break below $3,320 could lead to a test of $3,300 or even $3,268.
💡 Suggested Trading Strategy
SELL XAU/USD : $3,395–$3,3400
o 🎯 TP: 40/80/200 pips
o ❌ SL: ~$3,405
BUY XAU/USD :$3,325–$3,330
o 🎯 TP: 40/80/200 pips
o ❌ SL: ~$3,320
Gold prices remain firm above the 20-day EMA and 50-day MA, reflecting increased safe-haven demand amid ongoing trade tensions and growing expectations of a Fed rate cut.
The price is currently testing the resistance area around $3,400/oz, while immediate support lies in the $3,320–$3,330/oz range.
📉 Technical Analysis
• Key Resistance:
- $3,400
- Followed by: $3,420–$3,435
• Nearest Support:
$3,320–$3,330
- If broken, next levels are $3,300–$3,268
• EMA Position:
- Gold remains above both the 20-day EMA and 50-day MA, indicating a short-term uptrend
• Patterns & Momentum:
- RSI ~54 (neutral), MACD positive – indicating underlying bullish momentum
- EMA 8/21 crossover is turning upward, signaling short-term bullish reversal potential
📌 Outlook
Gold may continue rising modestly if it holds above the $3,320–$3,330 support zone and successfully breaches the $3,400 resistance. However, a break below $3,320 could lead to a test of $3,300 or even $3,268.
💡 Suggested Trading Strategy
SELL XAU/USD : $3,395–$3,3400
o 🎯 TP: 40/80/200 pips
o ❌ SL: ~$3,405
BUY XAU/USD :$3,325–$3,330
o 🎯 TP: 40/80/200 pips
o ❌ SL: ~$3,320
تم فتح الصفقة
If the bullish trend continues, gold could break above the $3,390 zone and target the next key resistance at $3,420–$3,435 in the short term.أغلقت الصفقة: تم الوصول للهدف
If gold holds above $3,392, prioritize buying with the trend;If it breaks below this level, look for short-term sells toward $3,380.

📊 Forex | Gold | Crypto Market Insights
📰 Real-time news updates & expert analysis
💡 Technical breakdowns & market outlooks
🔗 Join our free group: telegram.me/+DmS-dVFJMm40MDM9
📰 Real-time news updates & expert analysis
💡 Technical breakdowns & market outlooks
🔗 Join our free group: telegram.me/+DmS-dVFJMm40MDM9
منشورات ذات صلة
إخلاء المسؤولية
لا يُقصد بالمعلومات والمنشورات أن تكون، أو تشكل، أي نصيحة مالية أو استثمارية أو تجارية أو أنواع أخرى من النصائح أو التوصيات المقدمة أو المعتمدة من TradingView. اقرأ المزيد في شروط الاستخدام.
📊 Forex | Gold | Crypto Market Insights
📰 Real-time news updates & expert analysis
💡 Technical breakdowns & market outlooks
🔗 Join our free group: telegram.me/+DmS-dVFJMm40MDM9
📰 Real-time news updates & expert analysis
💡 Technical breakdowns & market outlooks
🔗 Join our free group: telegram.me/+DmS-dVFJMm40MDM9
منشورات ذات صلة
إخلاء المسؤولية
لا يُقصد بالمعلومات والمنشورات أن تكون، أو تشكل، أي نصيحة مالية أو استثمارية أو تجارية أو أنواع أخرى من النصائح أو التوصيات المقدمة أو المعتمدة من TradingView. اقرأ المزيد في شروط الاستخدام.