
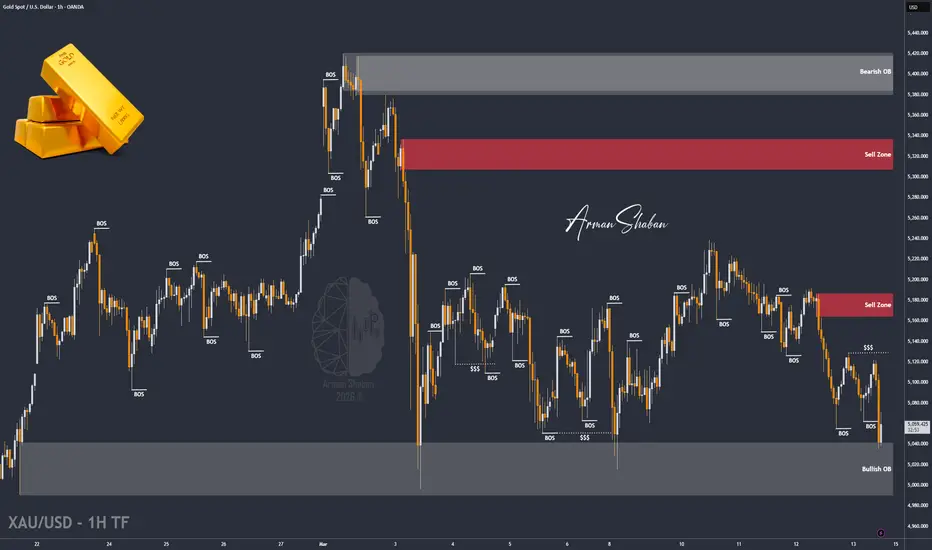
By analyzing the #Gold chart on the 1-hour timeframe, we can see that after the previous update where price was attempting to stabilize above the $5185 level, the bullish continuation scenario failed to hold. Instead of expanding higher, Gold entered a deeper corrective phase and experienced a sharp sell-off from around $5100 down to $5035, confirming strong short-term selling pressure in the market.
However, this decline brought price directly into the previous demand zone between $4990 and $5040, where buying interest once again appeared and prevented further downside. Following this reaction, Gold has managed to rebound slightly and is currently trading around the $5066 region, showing early signs of stabilization after the aggressive drop.
At this stage, the $5050 level becomes the key short-term pivot for determining the next move. If price manages to hold and stabilize above $5050, we may see a recovery move toward $5110 as the first upside target. However, if Gold fails to maintain support above this level, the market could revisit the $4990 demand region once again, potentially triggering another downside move before the next major reaction. As always, this chart will continue to be updated step by step as price reacts to the next important levels.
Please support me with your likes and comments to motivate me to share more analysis with you and share your opinion about the possible trend of this chart with me !
Best Regards , Arman Shaban
However, this decline brought price directly into the previous demand zone between $4990 and $5040, where buying interest once again appeared and prevented further downside. Following this reaction, Gold has managed to rebound slightly and is currently trading around the $5066 region, showing early signs of stabilization after the aggressive drop.
At this stage, the $5050 level becomes the key short-term pivot for determining the next move. If price manages to hold and stabilize above $5050, we may see a recovery move toward $5110 as the first upside target. However, if Gold fails to maintain support above this level, the market could revisit the $4990 demand region once again, potentially triggering another downside move before the next major reaction. As always, this chart will continue to be updated step by step as price reacts to the next important levels.
Please support me with your likes and comments to motivate me to share more analysis with you and share your opinion about the possible trend of this chart with me !
Best Regards , Arman Shaban

📘 Wanna Learn ICT & SMC? Get the Full Book Here : bit.ly/ICT-BOOK
⚜️ Free Telegram Channel : telegram.me/PriceAction_ICT
⚜️ JOIN THE VIP 👉 t.me/ArmanShabanTrading
🚀 MondFX — our trusted Broker : bit.ly/MondFx
⚜️ Free Telegram Channel : telegram.me/PriceAction_ICT
⚜️ JOIN THE VIP 👉 t.me/ArmanShabanTrading
🚀 MondFX — our trusted Broker : bit.ly/MondFx
منشورات ذات صلة
إخلاء المسؤولية
لا يُقصد بالمعلومات والمنشورات أن تكون، أو تشكل، أي نصيحة مالية أو استثمارية أو تجارية أو أنواع أخرى من النصائح أو التوصيات المقدمة أو المعتمدة من TradingView. اقرأ المزيد في شروط الاستخدام.
📘 Wanna Learn ICT & SMC? Get the Full Book Here : bit.ly/ICT-BOOK
⚜️ Free Telegram Channel : telegram.me/PriceAction_ICT
⚜️ JOIN THE VIP 👉 t.me/ArmanShabanTrading
🚀 MondFX — our trusted Broker : bit.ly/MondFx
⚜️ Free Telegram Channel : telegram.me/PriceAction_ICT
⚜️ JOIN THE VIP 👉 t.me/ArmanShabanTrading
🚀 MondFX — our trusted Broker : bit.ly/MondFx
منشورات ذات صلة
إخلاء المسؤولية
لا يُقصد بالمعلومات والمنشورات أن تكون، أو تشكل، أي نصيحة مالية أو استثمارية أو تجارية أو أنواع أخرى من النصائح أو التوصيات المقدمة أو المعتمدة من TradingView. اقرأ المزيد في شروط الاستخدام.