
XAUUSD Short: Forms Head & Shoulders - Breakdown Below 5,100
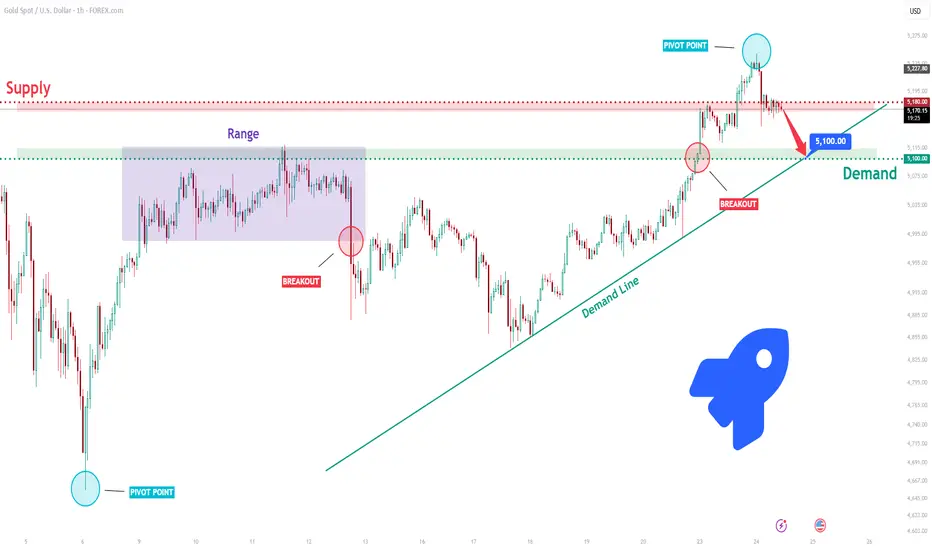
Hello traders! Here’s my technical outlook on XAUUSD (1H) based on the current chart structure. Gold is currently trading within a broader bullish context after establishing a strong pivot low, from which price initiated a steady recovery. This advance developed with clear higher highs and higher lows, confirming improving buyer control. During the early phase of this move, price entered a well-defined horizontal range, where the market paused and consolidated as buyers and sellers reached short-term equilibrium. This range acted as an accumulation phase rather than distribution, as repeated tests of the lower boundary were absorbed and followed by higher reactions. Eventually, price broke out to the downside from the range, triggering a brief corrective move, but this breakdown lacked follow-through and was quickly met by demand, suggesting it was a liquidity grab rather than a true bearish continuation. Following this false breakdown, XAUUSD resumed its bullish trajectory, reclaiming key structure levels and forming a rising demand trend line.
Currently, the price action has now developed a classic Head & Shoulders pattern. The first push into supply formed the left shoulder, followed by a stronger impulsive rally that created the head at the pivot high. Importantly, this high was met with sharp rejection, confirming strong selling interest at premium levels. The subsequent recovery attempt failed to reach the previous high, forming a lower high, which now acts as the right shoulder. This sequence reflects diminishing bullish strength and increasing seller dominance. The neckline of this pattern aligns closely with the 5,100 Demand Zone, which has already been tested multiple times. Repeated tests of this level weaken demand, increasing the probability of a breakdown. The rising demand line also converges with the neckline, making this area a critical structural level. A decisive break and acceptance below the neckline would confirm completion of the Head & Shoulders pattern and signal a trend reversal from bullish to bearish.
My primary scenario favors short continuation upon a confirmed breakdown below the 5,100 support zone and neckline. A strong bearish candle close below this level would validate the pattern and open the path for a downside move toward the next demand area around 5,020–5,000 (TP1), which aligns with prior structure and liquidity. This zone represents the most logical area for price to seek support after the pattern completion. However, if price fails to break the neckline and instead reclaims acceptance above the right shoulder and supply zone, the bearish scenario would be invalidated and suggest continuation of the broader bullish trend. Until such confirmation occurs, the Head & Shoulders structure, weakening momentum, and repeated rejection from supply favor sellers. Manage your risk!
Currently, the price action has now developed a classic Head & Shoulders pattern. The first push into supply formed the left shoulder, followed by a stronger impulsive rally that created the head at the pivot high. Importantly, this high was met with sharp rejection, confirming strong selling interest at premium levels. The subsequent recovery attempt failed to reach the previous high, forming a lower high, which now acts as the right shoulder. This sequence reflects diminishing bullish strength and increasing seller dominance. The neckline of this pattern aligns closely with the 5,100 Demand Zone, which has already been tested multiple times. Repeated tests of this level weaken demand, increasing the probability of a breakdown. The rising demand line also converges with the neckline, making this area a critical structural level. A decisive break and acceptance below the neckline would confirm completion of the Head & Shoulders pattern and signal a trend reversal from bullish to bearish.
My primary scenario favors short continuation upon a confirmed breakdown below the 5,100 support zone and neckline. A strong bearish candle close below this level would validate the pattern and open the path for a downside move toward the next demand area around 5,020–5,000 (TP1), which aligns with prior structure and liquidity. This zone represents the most logical area for price to seek support after the pattern completion. However, if price fails to break the neckline and instead reclaims acceptance above the right shoulder and supply zone, the bearish scenario would be invalidated and suggest continuation of the broader bullish trend. Until such confirmation occurs, the Head & Shoulders structure, weakening momentum, and repeated rejection from supply favor sellers. Manage your risk!
أغلقت الصفقة: تم الوصول للهدف
As we expected, the price of gold has completed the shoulder formation and we have reached our target, however, the uptrend itself has not changed yet, although we have a pattern that signals a trend change.
🔶 Free telegram channel👉 t.me/heniitrading
🔥 Join our paid VIP community with Forex and Crypto signals in order to improve your trading skills, my contact 👉 t.me/henii_trader
💎 I'm open for cooperation/advertising, not interested in rebate
🔥 Join our paid VIP community with Forex and Crypto signals in order to improve your trading skills, my contact 👉 t.me/henii_trader
💎 I'm open for cooperation/advertising, not interested in rebate
إخلاء المسؤولية
لا يُقصد بالمعلومات والمنشورات أن تكون، أو تشكل، أي نصيحة مالية أو استثمارية أو تجارية أو أنواع أخرى من النصائح أو التوصيات المقدمة أو المعتمدة من TradingView. اقرأ المزيد في شروط الاستخدام.
🔶 Free telegram channel👉 t.me/heniitrading
🔥 Join our paid VIP community with Forex and Crypto signals in order to improve your trading skills, my contact 👉 t.me/henii_trader
💎 I'm open for cooperation/advertising, not interested in rebate
🔥 Join our paid VIP community with Forex and Crypto signals in order to improve your trading skills, my contact 👉 t.me/henii_trader
💎 I'm open for cooperation/advertising, not interested in rebate
إخلاء المسؤولية
لا يُقصد بالمعلومات والمنشورات أن تكون، أو تشكل، أي نصيحة مالية أو استثمارية أو تجارية أو أنواع أخرى من النصائح أو التوصيات المقدمة أو المعتمدة من TradingView. اقرأ المزيد في شروط الاستخدام.