
Gold breaks below $4000 – Downtrend extends toward $3950
📊 Market Overview
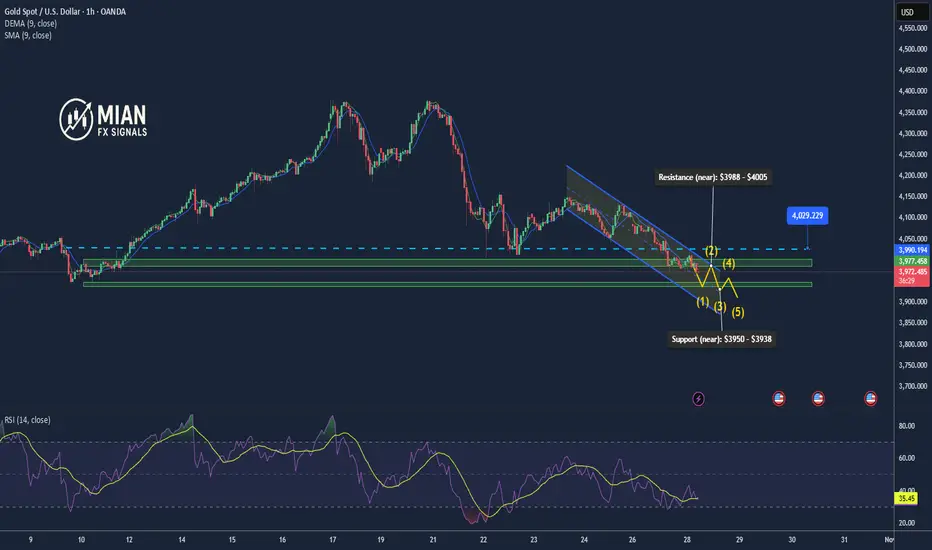
Gold prices continued to drop sharply today, falling to around $3970/oz after breaking the key psychological level of $4000. Profit-taking pressure and a stronger USD weighed on the metal. Rising U.S. Treasury yields and expectations that the Federal Reserve may delay rate cuts further weakened investors’ appetite for gold.
🧭 Technical Analysis
• Trend: Strongly bearish; H1–H4 charts show an extended downward wave.
• Resistance (near): $3988 – $4005
• Resistance (upper): $4025 – $4040
• Support (near): $3950 – $3938
• EMA 50 & 200 (H1): EMA50 crossing below EMA200 confirms bearish bias.
• Candlestick pattern: Series of long-bodied bearish candles showing strong selling momentum.
• RSI (H1): 28 – oversold zone; possible short-term technical rebound.
💡 Outlook
Gold remains in a deep correction phase after several weeks of strong gains. The area between $3950–$3938 may trigger technical buying or short covering. If prices fail to break above $4005, the downtrend could extend toward $3920–$3900.
⚙️ 4. Trading Strategy
🔻 SELL XAU/USD : $4000 – $4003
🎯 TP: 40 / 80 / 200 pips
🛑 SL: $4007
🔺 BUY XAU/USD : $3938 – $3941
🎯 TP: 40 / 80 / 200 pips
🛑 SL: $3934
Gold prices continued to drop sharply today, falling to around $3970/oz after breaking the key psychological level of $4000. Profit-taking pressure and a stronger USD weighed on the metal. Rising U.S. Treasury yields and expectations that the Federal Reserve may delay rate cuts further weakened investors’ appetite for gold.
🧭 Technical Analysis
• Trend: Strongly bearish; H1–H4 charts show an extended downward wave.
• Resistance (near): $3988 – $4005
• Resistance (upper): $4025 – $4040
• Support (near): $3950 – $3938
• EMA 50 & 200 (H1): EMA50 crossing below EMA200 confirms bearish bias.
• Candlestick pattern: Series of long-bodied bearish candles showing strong selling momentum.
• RSI (H1): 28 – oversold zone; possible short-term technical rebound.
💡 Outlook
Gold remains in a deep correction phase after several weeks of strong gains. The area between $3950–$3938 may trigger technical buying or short covering. If prices fail to break above $4005, the downtrend could extend toward $3920–$3900.
⚙️ 4. Trading Strategy
🔻 SELL XAU/USD : $4000 – $4003
🎯 TP: 40 / 80 / 200 pips
🛑 SL: $4007
🔺 BUY XAU/USD : $3938 – $3941
🎯 TP: 40 / 80 / 200 pips
🛑 SL: $3934
تم فتح الصفقة
Gold is making a technical rebound; prefer to sell again around 3968 if a reversal signal appears.أغلقت الصفقة: تم الوصول للهدف
Gold is testing the $3900 support; if it breaks below, the downtrend could extend toward $3870.
📊 Forex | Gold | Crypto Market Insights
📰 Real-time news updates & expert analysis
💡 Technical breakdowns & market outlooks
🔗 Join our free group: telegram.me/+DmS-dVFJMm40MDM9
📰 Real-time news updates & expert analysis
💡 Technical breakdowns & market outlooks
🔗 Join our free group: telegram.me/+DmS-dVFJMm40MDM9
منشورات ذات صلة
إخلاء المسؤولية
لا يُقصد بالمعلومات والمنشورات أن تكون، أو تشكل، أي نصيحة مالية أو استثمارية أو تجارية أو أنواع أخرى من النصائح أو التوصيات المقدمة أو المعتمدة من TradingView. اقرأ المزيد في شروط الاستخدام.
📊 Forex | Gold | Crypto Market Insights
📰 Real-time news updates & expert analysis
💡 Technical breakdowns & market outlooks
🔗 Join our free group: telegram.me/+DmS-dVFJMm40MDM9
📰 Real-time news updates & expert analysis
💡 Technical breakdowns & market outlooks
🔗 Join our free group: telegram.me/+DmS-dVFJMm40MDM9
منشورات ذات صلة
إخلاء المسؤولية
لا يُقصد بالمعلومات والمنشورات أن تكون، أو تشكل، أي نصيحة مالية أو استثمارية أو تجارية أو أنواع أخرى من النصائح أو التوصيات المقدمة أو المعتمدة من TradingView. اقرأ المزيد في شروط الاستخدام.