
XAUUSD – Major H1 Supply Zone Rejection & Potential Drop Setup
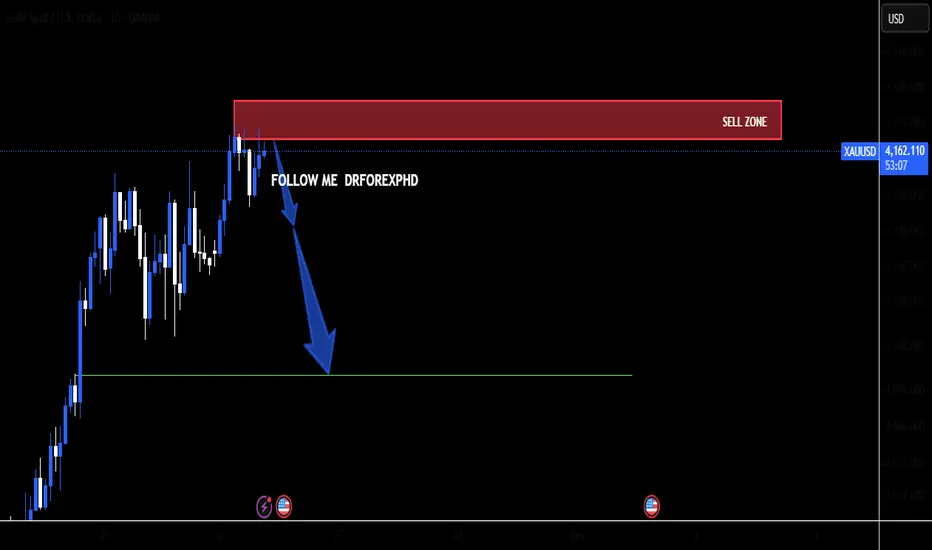
📉 Chart Analysis (H1 – Gold / XAUUSD)
1. Price at Strong Supply / Sell Zone
The red zone you highlighted represents a major H1 supply area, where price previously rejected.
Multiple wicks indicate selling pressure, showing buyers are weakening.
2. Current Price Reaction
Price is consolidating just below the supply zone.
This typically suggests liquidity building before a potential sell-off.
3. Bearish Confluence
The arrows show your anticipated movement:
retest → rejection → drop.
Structure supports this idea:
Lower highs forming near resistance.
Buyers failing to break above the supply area.
4. Downside Target
The green line represents the next significant support level, likely a demand zone.
This is a logical TP1 area for sellers.
5. Trade Idea Summary
Bias: Bearish from supply zone.
Entry: Sell on rejection inside red zone.
TP: Green support area.
SL: Above the supply zone wick.
1. Price at Strong Supply / Sell Zone
The red zone you highlighted represents a major H1 supply area, where price previously rejected.
Multiple wicks indicate selling pressure, showing buyers are weakening.
2. Current Price Reaction
Price is consolidating just below the supply zone.
This typically suggests liquidity building before a potential sell-off.
3. Bearish Confluence
The arrows show your anticipated movement:
retest → rejection → drop.
Structure supports this idea:
Lower highs forming near resistance.
Buyers failing to break above the supply area.
4. Downside Target
The green line represents the next significant support level, likely a demand zone.
This is a logical TP1 area for sellers.
5. Trade Idea Summary
Bias: Bearish from supply zone.
Entry: Sell on rejection inside red zone.
TP: Green support area.
SL: Above the supply zone wick.
تم فتح الصفقة

إخلاء المسؤولية
لا يُقصد بالمعلومات والمنشورات أن تكون، أو تشكل، أي نصيحة مالية أو استثمارية أو تجارية أو أنواع أخرى من النصائح أو التوصيات المقدمة أو المعتمدة من TradingView. اقرأ المزيد في شروط الاستخدام.
إخلاء المسؤولية
لا يُقصد بالمعلومات والمنشورات أن تكون، أو تشكل، أي نصيحة مالية أو استثمارية أو تجارية أو أنواع أخرى من النصائح أو التوصيات المقدمة أو المعتمدة من TradingView. اقرأ المزيد في شروط الاستخدام.