
GOLD BREAKS ABOVE H4 TRENDLINE – RECOVERY OR TRAP? GOLD 15/06
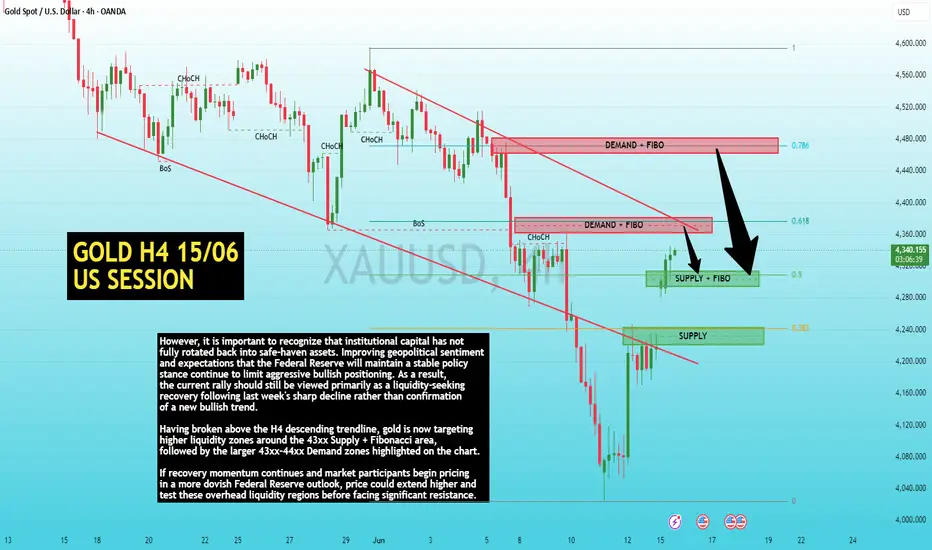
Gold enters the first U.S. session of the new week with a noticeably different tone compared to last week’s aggressive selloff. After collapsing from the 44xx region toward 40xx, the market has staged a strong recovery from the lows and successfully reclaimed the short-term descending trendline on the H4 timeframe. This suggests that extreme selling pressure has eased for now, allowing price to enter a rebalancing phase ahead of a critical macroeconomic week.
From a macro perspective, the current recovery is not purely technical. Markets have begun to question the narrative of uninterrupted U.S. economic strength after a series of mixed economic releases. At the same time, the recent pause in U.S. Dollar strength and Treasury yield momentum has provided room for gold to recover from deeply oversold conditions.
However, it is important to recognize that institutional capital has not fully rotated back into safe-haven assets. Improving geopolitical sentiment and expectations that the Federal Reserve will maintain a stable policy stance continue to limit aggressive bullish positioning. As a result, the current rally should still be viewed primarily as a liquidity-seeking recovery following last week's sharp decline rather than confirmation of a new bullish trend.
PRIMARY SCENARIO
Having broken above the H4 descending trendline, gold is now targeting higher liquidity zones around the 43xx Supply + Fibonacci area, followed by the larger 43xx–44xx Demand zones highlighted on the chart.
If recovery momentum continues and market participants begin pricing in a more dovish Federal Reserve outlook, price could extend higher and test these overhead liquidity regions before facing significant resistance.
ALTERNATIVE SCENARIO
If buying pressure fades as price approaches the highlighted Supply and Demand zones, the market may treat the current move as nothing more than a corrective rally within a broader bearish structure.
In that case, the overhead liquidity zones could become attractive areas for sellers to re-enter the market, especially if upcoming Retail Sales data and the FOMC meeting reinforce U.S. Dollar strength later this week.
SHORT-TERM BIAS
Bullish recovery above the broken H4 descending trendline.
LONG-TERM BIAS
Still bearish while price remains below the major Daily descending trendline and key liquidity zones overhead.
LucasGrayTrading 📈📉🔥
From a macro perspective, the current recovery is not purely technical. Markets have begun to question the narrative of uninterrupted U.S. economic strength after a series of mixed economic releases. At the same time, the recent pause in U.S. Dollar strength and Treasury yield momentum has provided room for gold to recover from deeply oversold conditions.
However, it is important to recognize that institutional capital has not fully rotated back into safe-haven assets. Improving geopolitical sentiment and expectations that the Federal Reserve will maintain a stable policy stance continue to limit aggressive bullish positioning. As a result, the current rally should still be viewed primarily as a liquidity-seeking recovery following last week's sharp decline rather than confirmation of a new bullish trend.
PRIMARY SCENARIO
Having broken above the H4 descending trendline, gold is now targeting higher liquidity zones around the 43xx Supply + Fibonacci area, followed by the larger 43xx–44xx Demand zones highlighted on the chart.
If recovery momentum continues and market participants begin pricing in a more dovish Federal Reserve outlook, price could extend higher and test these overhead liquidity regions before facing significant resistance.
ALTERNATIVE SCENARIO
If buying pressure fades as price approaches the highlighted Supply and Demand zones, the market may treat the current move as nothing more than a corrective rally within a broader bearish structure.
In that case, the overhead liquidity zones could become attractive areas for sellers to re-enter the market, especially if upcoming Retail Sales data and the FOMC meeting reinforce U.S. Dollar strength later this week.
SHORT-TERM BIAS
Bullish recovery above the broken H4 descending trendline.
LONG-TERM BIAS
Still bearish while price remains below the major Daily descending trendline and key liquidity zones overhead.
LucasGrayTrading 📈📉🔥
تم فتح الصفقة
Gold continues to respect the bearish roadmap outlined in the previous plan. Despite the strong recovery from the 40xx bottom, buyers failed to maintain momentum once price reached the confluence of the Demand + Fibonacci + descending trendline resistance around 437x.As anticipated, this area attracted fresh selling pressure and triggered a rejection of nearly 700 points, pushing gold back toward the 430x region. This reaction confirms that higher-timeframe sellers remain active and that the broader market structure has not yet shifted bullish.
From a macro perspective, the rebound was largely driven by risk-off flows and short-covering after the aggressive selloff of the previous week. However, improving sentiment surrounding geopolitical developments and the absence of new bullish catalysts for gold continue to limit upside expansion. Institutional money remains cautious ahead of upcoming economic data and the FOMC meeting.
At the moment, gold is reacting around the Supply + Fibonacci zone near 430x. This area becomes the first line of defense for buyers. A sustained hold above this region could allow another recovery attempt toward the 437x resistance cluster. However, as long as price remains below the major descending trendline and the Demand zones overhead, rallies should still be viewed as corrective moves within a broader bearish structure.
MARKET STATUS
✅ Demand + Fibonacci + Trendline resistance at 437x successfully defended sellers.
✅ Bearish reaction delivered approximately 700 points from the projected zone.
✅ Price is now testing Supply + Fibonacci support around 430x.
⚠️ Short-term rebound possible, but the larger H4 structure remains bearish below 437x.
LucasGrayTrading 📉🔥

Daily trend & Supply/Demand insights 📊
👉 t.me/+cZC_DmEr3OwzOTA1
High-probability zones & structured setups
Clear scenarios for better decision-making
Trade smarter with LucasGrayTrading 🎖
👉 t.me/+cZC_DmEr3OwzOTA1
High-probability zones & structured setups
Clear scenarios for better decision-making
Trade smarter with LucasGrayTrading 🎖
إخلاء المسؤولية
لا يُقصد بالمعلومات والمنشورات أن تكون، أو تشكل، أي نصيحة مالية أو استثمارية أو تجارية أو أنواع أخرى من النصائح أو التوصيات المقدمة أو المعتمدة من TradingView. اقرأ المزيد في شروط الاستخدام.
Daily trend & Supply/Demand insights 📊
👉 t.me/+cZC_DmEr3OwzOTA1
High-probability zones & structured setups
Clear scenarios for better decision-making
Trade smarter with LucasGrayTrading 🎖
👉 t.me/+cZC_DmEr3OwzOTA1
High-probability zones & structured setups
Clear scenarios for better decision-making
Trade smarter with LucasGrayTrading 🎖
إخلاء المسؤولية
لا يُقصد بالمعلومات والمنشورات أن تكون، أو تشكل، أي نصيحة مالية أو استثمارية أو تجارية أو أنواع أخرى من النصائح أو التوصيات المقدمة أو المعتمدة من TradingView. اقرأ المزيد في شروط الاستخدام.