
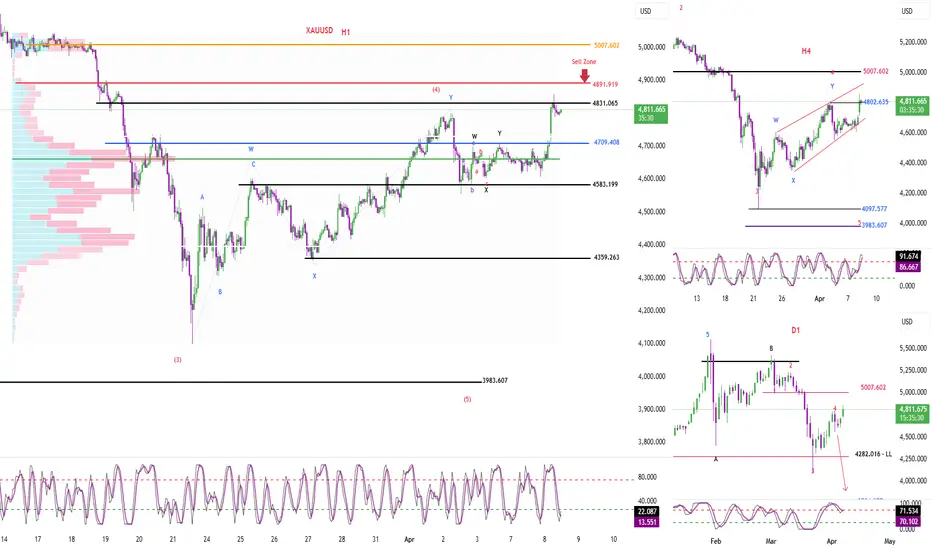
Momentum
D1
D1 momentum is currently showing signs of a reversal.
→ We need to wait for today’s candle close for confirmation.
If bullish momentum is maintained:
→ There is a high probability that the upward move will continue.
If the session closes bearish:
→ The upward move may have ended
→ Price may return to a downtrend or move sideways.
H4
H4 momentum is increasing, and the current move is at the 4th bullish candle.
→ This upward move may continue for another 1–2 H4 candles.
→ After that, a reversal on H4 may occur.
H1
H1 momentum is preparing to reverse upward.
→ If confirmed:
→ There is a high probability of a short-term upward move or sideways movement on H1.
Wave Structure
D1
With the strong bullish move breaking the previous high:
→ The scenario of Wave 4 being completed is invalidated.
Currently, there are two possibilities:
Wave 4 is still ongoing
We are in Wave 1 of a new bullish cycle
As mentioned in previous analysis:
→ The ideal condition was a panic sell-off on D1 to complete Wave 5.
→ However, this did not happen
→ Instead, we have two strong consecutive bullish candles
→ If D1 confirms a bullish reversal:
→ The upward move is likely to continue
→ And the market may enter a new bullish cycle
H4
There are currently two scenarios:
The current upward move is an ABCDE corrective structure
Or a leading triangle structure
Common point:
→ Both form a triangle pattern
→ After completion, a strong downward move may occur
Difference:
If it is a corrective structure:
→ The decline will be deep
→ Because it will be Wave 5 → potentially reaching lower targets
If it is a leading triangle (Wave 1):
→ The decline will be shallow
→ Followed by a strong Wave 3 bullish expansion
Key level: 5007
→ If price breaks this level:
→ The corrective scenario is invalidated
→ The market may enter a new structure
H1
H1 momentum is currently increasing
→ There is a possibility of a continued short-term upward move
→ However:
H4 momentum is preparing to reverse
→ This indicates that the current upward move is weakening
Volume Profile
A strong liquidity zone is located above at 4891
→ Expect a downward move from this area
→ At least following the H4 reversal
Trading Plan
Setup
Sell Zone: 4890 – 4893
SL: 4916
Take Profit:
TP1: 4831
TP2: 4709
TP3: 4583
تم فتح الصفقة
Market Update
– H4 momentum is showing signs of a bearish reversal.
→ We need to wait for the H4 candle to close (about 1 hour remaining) for confirmation.
→ If the bearish momentum is confirmed, there is a high probability of a downtrend lasting around 4–5 H4 candles.
– H1 momentum is currently increasing.
→ We wait for H1 to reach the overbought zone.
→ If price fails to break the previous high, there is a high probability of a top formation.
→ In case price breaks the previous high:
→ Continue to follow the original trading plan.

📢 Sometimes signals appear on TradingView with a slight delay!
🚀 Join our Telegram channel to get instant updates and real-time scalping signals:
👉 t.me/+lASNLyXKqcFiYmJl
🚀 Join our Telegram channel to get instant updates and real-time scalping signals:
👉 t.me/+lASNLyXKqcFiYmJl
منشورات ذات صلة
إخلاء المسؤولية
لا يُقصد بالمعلومات والمنشورات أن تكون، أو تشكل، أي نصيحة مالية أو استثمارية أو تجارية أو أنواع أخرى من النصائح أو التوصيات المقدمة أو المعتمدة من TradingView. اقرأ المزيد في شروط الاستخدام.
📢 Sometimes signals appear on TradingView with a slight delay!
🚀 Join our Telegram channel to get instant updates and real-time scalping signals:
👉 t.me/+lASNLyXKqcFiYmJl
🚀 Join our Telegram channel to get instant updates and real-time scalping signals:
👉 t.me/+lASNLyXKqcFiYmJl
منشورات ذات صلة
إخلاء المسؤولية
لا يُقصد بالمعلومات والمنشورات أن تكون، أو تشكل، أي نصيحة مالية أو استثمارية أو تجارية أو أنواع أخرى من النصائح أو التوصيات المقدمة أو المعتمدة من TradingView. اقرأ المزيد في شروط الاستخدام.