
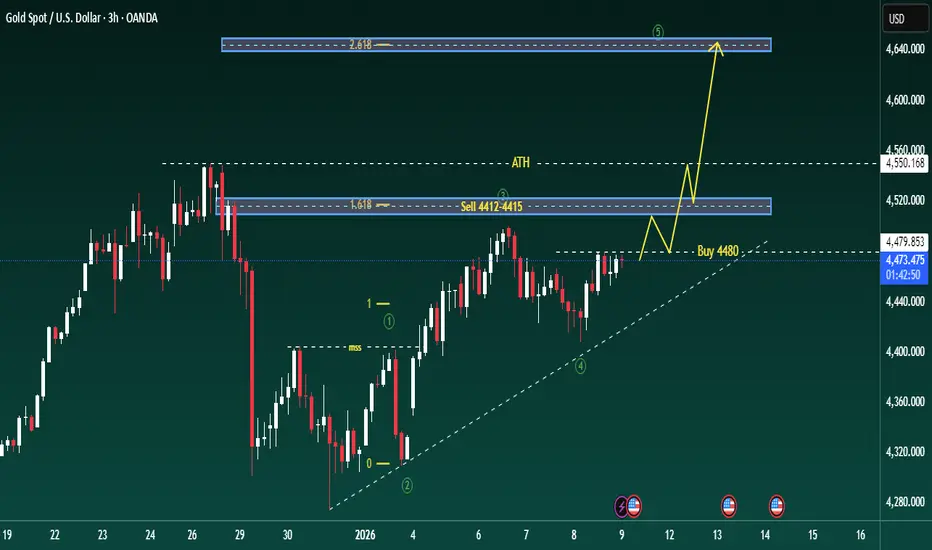
Gold is trading in a sensitive zone just below all-time highs, where liquidity, Fibonacci extensions, and trend structure are converging. Price action suggests a controlled rotation rather than a clean breakout, with clear reaction levels on both sides.
TECHNICAL STRUCTURE (H3)
Gold remains in a broader bullish structure, with higher lows supported by an ascending trendline.
The recent impulse confirmed bullish intent, but price is now stalling near premium liquidity, signalling potential short-term distribution.
Market behaviour shows buy-the-dip dynamics, while upside extensions are being tested selectively.
KEY LEVELS FROM THE CHART
Upper liquidity / extension zone:
Fibonacci 2.618 extension near the top band
This area represents profit-taking and sell-side liquidity, especially if price reaches it with weak momentum.
Sell reaction zone:
4412 – 4415 (Fibonacci 1.618 + prior ATH reaction)
A classic area for short-term rejection if price fails to break and hold above.
Buy-side focus:
4480
This level acts as a buy-on-pullback zone, aligned with trendline support and prior bullish structure.
Expected flow:
Price holds above 4480 → attempts to push toward ATH → potential extension into the 2.618 zone.
Failure to hold 4480 → rotation back toward lower structure for liquidity rebalance.
MARKET BEHAVIOUR & LIQUIDITY LOGIC
Current structure favours reaction-based trading, not chasing breakouts.
Liquidity above ATH is attractive, but the market may need multiple attempts or a deeper pullback before a sustained breakout.
As long as higher lows are respected, pullbacks remain corrective.
MACRO CONTEXT – DXY BACK ABOVE 99
The US Dollar Index (DXY) has climbed above 99 for the first time since December 10, gaining 0.14% on the day.
A firmer USD can slow gold’s upside momentum in the short term.
However, gold’s ability to hold structure despite a stronger dollar highlights underlying demand and strong positioning.
This divergence suggests gold is not purely trading off USD weakness, but also off liquidity, positioning, and risk hedging flows.
SUMMARY VIEW
Gold remains structurally bullish on H3
Short-term price action is driven by liquidity near ATH
4480 is the key level defining bullish continuation
Upside extensions may require consolidation or pullbacks before a clean break
In this environment, patience and level-based execution matter more than directional bias.
تم فتح الصفقة
Update plan Buy and Sell +450 pips

🔥 BrianLionCapital – Where Top Traders Unite
✅ Accurate signals & exclusive analysis: 10–15 signals daily with continuous market insights
⏳ Every minute you hesitate is a winning opportunity slipping away!
t.me/+PNA9TDWpr_80ZGQ1
✅ Accurate signals & exclusive analysis: 10–15 signals daily with continuous market insights
⏳ Every minute you hesitate is a winning opportunity slipping away!
t.me/+PNA9TDWpr_80ZGQ1
منشورات ذات صلة
إخلاء المسؤولية
لا يُقصد بالمعلومات والمنشورات أن تكون، أو تشكل، أي نصيحة مالية أو استثمارية أو تجارية أو أنواع أخرى من النصائح أو التوصيات المقدمة أو المعتمدة من TradingView. اقرأ المزيد في شروط الاستخدام.
🔥 BrianLionCapital – Where Top Traders Unite
✅ Accurate signals & exclusive analysis: 10–15 signals daily with continuous market insights
⏳ Every minute you hesitate is a winning opportunity slipping away!
t.me/+PNA9TDWpr_80ZGQ1
✅ Accurate signals & exclusive analysis: 10–15 signals daily with continuous market insights
⏳ Every minute you hesitate is a winning opportunity slipping away!
t.me/+PNA9TDWpr_80ZGQ1
منشورات ذات صلة
إخلاء المسؤولية
لا يُقصد بالمعلومات والمنشورات أن تكون، أو تشكل، أي نصيحة مالية أو استثمارية أو تجارية أو أنواع أخرى من النصائح أو التوصيات المقدمة أو المعتمدة من TradingView. اقرأ المزيد في شروط الاستخدام.