
Gold In-Depth Technical Analysis: Key Pullback Expected After Wedge Breakout; Short-Term High-Level Correction a Warning
I. Market Fundamentals Overview
The gold market has recently been rising steadily amid fluctuations, primarily supported by global macroeconomic expectations. Although inflation data remains uncertain, the market is recalibrating its pricing of future monetary policies by major central banks (especially the Federal Reserve). Meanwhile, recurring geopolitical tensions and concerns about the growth prospects of major global economies continue to provide underlying buying support for gold as a safe-haven asset. However, after continuous gains, gold prices are currently facing a significant technical resistance zone, with increased short-term profit-taking pressure creating downward pressure for a short-term pullback.
II. In-Depth Technical Analysis
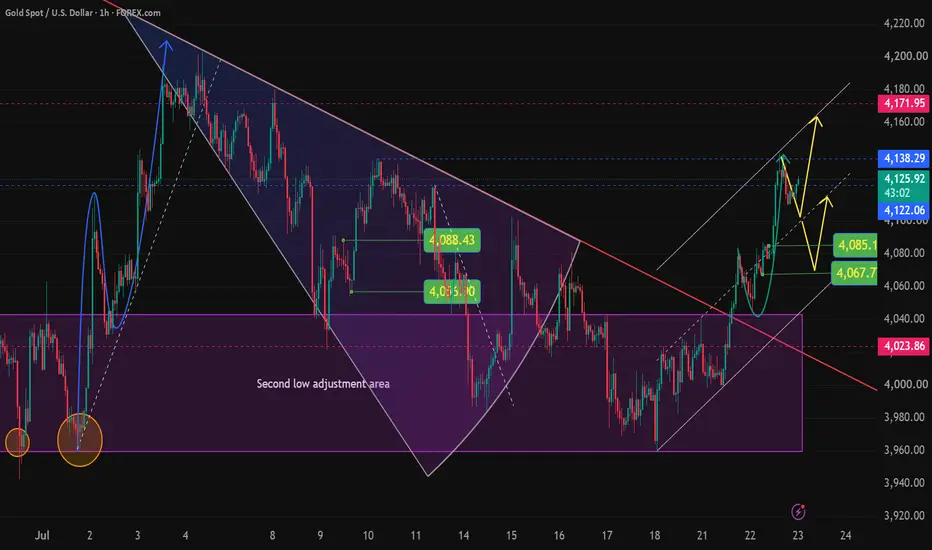
From a technical chart perspective, gold has experienced a classic "triangle consolidation" pattern over the past few weeks (marked by the purple area and red descending resistance line in the chart). This process ended with a strong bullish breakout in mid-July, after which gold prices steadily rose along an ascending channel (the two white sloping lines in the chart).
Pullback Confirmation After Breakout: Gold prices have successfully held above previous resistance levels (around 4,088 and 4,060) and broken through the key psychological level of 4,100. The yellow and white arrows on the chart indicate a bullish, step-like upward trend. However, the current price (around 4,124) is facing resistance at the important short-term resistance level of 4,138.
Ascending Channel Test: Prices are currently testing the upper boundary of the ascending channel. After two consecutive days of gains, the price action shows signs of stagnation at higher levels. The "Second low adjustment area" marked on the chart confirms strong support below. However, this does not preclude a deeper pullback towards the lower channel boundary (around 4,080-4,090) upon reaching the upper channel boundary.
Key Levels for Bulls and Bears:
Upside Resistance: Strong short-term resistance is around 4,138. A decisive break above this level would target 4,171 and then 4,200.
Downside Support: Initial short-term support lies in the 4,122 and 4,088 range.
III. Short-Term Trading Strategy: Shorting at Higher Levels
Given the current price action at the upper edge of an upward channel and the resistance at 4,138, coupled with divergence signs in momentum indicators like KD/RSI on the hourly chart, our short-term strategy is to "be bullish but not actively trade, and short at higher levels." We suggest initiating small short positions when the price touches the resistance zone.
🔥 Key short-term trading signals for Gold (XAUUSD) are as follows:
❤️┋ [XAUUSD] ┋❤️⏱️ Level: [60 minutes]
🎯 Direction: [SELL] @ [4125 - 4130] (It is recommended to enter in batches around 4128)
🛑 SL: [4145] ⏹️ (Strict stop loss; if this level is broken, it proves that the bullish momentum has not exhausted, and you should exit and observe)
✅ TP1: [4105] 💎 (First target level; after reaching it, you can move the stop loss to a protective level)
✅ TP2: [4090] 💎 (Second target level, i.e., the lower support area of the ascending channel)
IV. Summary and Risk Control
Although the overall medium-term trend remains bullish, the short-term gold price is in a key resistance area, and the demand for a pullback is strong. Strict stop loss measures are necessary in trading; avoid heavy leverage. If the price surges strongly and breaks through the 4,145 stop-loss level, short positions should be decisively abandoned, and a long position should be initiated.
💬 Investing is a journey of self-cultivation; technical skills are the foundation, but mindset is the key to victory.
If you enjoy this professional analysis combining charts and real-world signals, please remember to like ❤️ and follow me for daily in-depth analysis of the cutting-edge gold market!
💬 Feel free to leave your thoughts in the comments section, or tell me the specific instrument you'd like analyzed. Let's discuss and explore together, keeping abreast of market developments! 🚀
I. Market Fundamentals Overview
The gold market has recently been rising steadily amid fluctuations, primarily supported by global macroeconomic expectations. Although inflation data remains uncertain, the market is recalibrating its pricing of future monetary policies by major central banks (especially the Federal Reserve). Meanwhile, recurring geopolitical tensions and concerns about the growth prospects of major global economies continue to provide underlying buying support for gold as a safe-haven asset. However, after continuous gains, gold prices are currently facing a significant technical resistance zone, with increased short-term profit-taking pressure creating downward pressure for a short-term pullback.
II. In-Depth Technical Analysis
From a technical chart perspective, gold has experienced a classic "triangle consolidation" pattern over the past few weeks (marked by the purple area and red descending resistance line in the chart). This process ended with a strong bullish breakout in mid-July, after which gold prices steadily rose along an ascending channel (the two white sloping lines in the chart).
Pullback Confirmation After Breakout: Gold prices have successfully held above previous resistance levels (around 4,088 and 4,060) and broken through the key psychological level of 4,100. The yellow and white arrows on the chart indicate a bullish, step-like upward trend. However, the current price (around 4,124) is facing resistance at the important short-term resistance level of 4,138.
Ascending Channel Test: Prices are currently testing the upper boundary of the ascending channel. After two consecutive days of gains, the price action shows signs of stagnation at higher levels. The "Second low adjustment area" marked on the chart confirms strong support below. However, this does not preclude a deeper pullback towards the lower channel boundary (around 4,080-4,090) upon reaching the upper channel boundary.
Key Levels for Bulls and Bears:
Upside Resistance: Strong short-term resistance is around 4,138. A decisive break above this level would target 4,171 and then 4,200.
Downside Support: Initial short-term support lies in the 4,122 and 4,088 range.
III. Short-Term Trading Strategy: Shorting at Higher Levels
Given the current price action at the upper edge of an upward channel and the resistance at 4,138, coupled with divergence signs in momentum indicators like KD/RSI on the hourly chart, our short-term strategy is to "be bullish but not actively trade, and short at higher levels." We suggest initiating small short positions when the price touches the resistance zone.
🔥 Key short-term trading signals for Gold (XAUUSD) are as follows:
❤️┋ [XAUUSD] ┋❤️⏱️ Level: [60 minutes]
🎯 Direction: [SELL] @ [4125 - 4130] (It is recommended to enter in batches around 4128)
🛑 SL: [4145] ⏹️ (Strict stop loss; if this level is broken, it proves that the bullish momentum has not exhausted, and you should exit and observe)
✅ TP1: [4105] 💎 (First target level; after reaching it, you can move the stop loss to a protective level)
✅ TP2: [4090] 💎 (Second target level, i.e., the lower support area of the ascending channel)
IV. Summary and Risk Control
Although the overall medium-term trend remains bullish, the short-term gold price is in a key resistance area, and the demand for a pullback is strong. Strict stop loss measures are necessary in trading; avoid heavy leverage. If the price surges strongly and breaks through the 4,145 stop-loss level, short positions should be decisively abandoned, and a long position should be initiated.
💬 Investing is a journey of self-cultivation; technical skills are the foundation, but mindset is the key to victory.
If you enjoy this professional analysis combining charts and real-world signals, please remember to like ❤️ and follow me for daily in-depth analysis of the cutting-edge gold market!
💬 Feel free to leave your thoughts in the comments section, or tell me the specific instrument you'd like analyzed. Let's discuss and explore together, keeping abreast of market developments! 🚀

إخلاء المسؤولية
لا يُقصد بالمعلومات والمنشورات أن تكون، أو تشكل، أي نصيحة مالية أو استثمارية أو تجارية أو أنواع أخرى من النصائح أو التوصيات المقدمة أو المعتمدة من TradingView. اقرأ المزيد في شروط الاستخدام.
إخلاء المسؤولية
لا يُقصد بالمعلومات والمنشورات أن تكون، أو تشكل، أي نصيحة مالية أو استثمارية أو تجارية أو أنواع أخرى من النصائح أو التوصيات المقدمة أو المعتمدة من TradingView. اقرأ المزيد في شروط الاستخدام.