
✅ Technical Analysis Breakdown (XAUUSD – 1H Chart)
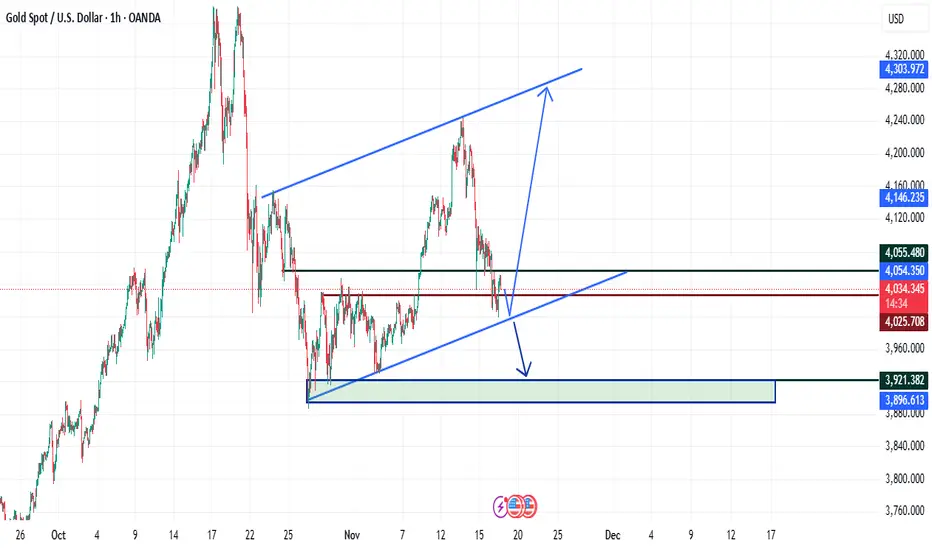
gold chart shows a rising wedge / ascending channel, and price is currently reacting at the mid-range support.
You’ve drawn two potential outcomes – continuation upward or bearish breakdown. Let’s analyze both with precision.
📌 1. Current Market Structure
Price is inside a large upward channel.
It recently rejected from the upper trendline, pulling back toward the mid-channel support.
Price is now sitting near the horizontal support zone ~ 4045–4034.
This is a reaction zone where the next direction should become clear.
📈 2. Bullish Scenario (Bounce & Rally Toward 4250+)
Conditions for upside:
Price must break and hold above 4055 (you marked this level).
Bullish structure resumes with higher lows.
Target moves:
1st target: 4160
2nd target: 4250
3rd target: Retest of the channel top near 4300–4330
Your blue arrow upward matches this exact pathway.
Why this can happen:
Price still respecting the ascending channel.
Mid-channel support is holding.
Buyers may step in near support.
📉 3. Bearish Scenario (Breakdown to 3920–3890 Zone)
This becomes active only if price breaks below the rising trendline around 4020–4010.
Bearish targets:
1st target: 3980
2nd target: 3920–3890 (your green demand zone)
This is a strong liquidity pool where buyers previously entered.
Your downward arrow correctly points toward this demand zone.
Why this can happen:
Rising wedge patterns often break down.
Momentum is currently weakening.
Massive liquidity below 4000.
🎯 4. What Is Most Likely Right Now?
Based on the chart:
✔ Price is testing support.
✔ Still inside the bullish channel.
✔ No confirmed breakdown yet.
➡ Bias: Short-term bullish unless 4020 breaks.
Once 4020 breaks cleanly → bearish continuation becomes very likely.
🧭 5. Simple Trading Plan (Based on Your Zones)
Bullish Setup
Buy above: 4055
SL: 4020
TP: 4160 → 4250 → 4320
Bearish Setup
Sell after breakdown below: 4020
SL: 4050
TP: 3980 → 3920 → 3890
For More Updates Stay Tuned
gold chart shows a rising wedge / ascending channel, and price is currently reacting at the mid-range support.
You’ve drawn two potential outcomes – continuation upward or bearish breakdown. Let’s analyze both with precision.
📌 1. Current Market Structure
Price is inside a large upward channel.
It recently rejected from the upper trendline, pulling back toward the mid-channel support.
Price is now sitting near the horizontal support zone ~ 4045–4034.
This is a reaction zone where the next direction should become clear.
📈 2. Bullish Scenario (Bounce & Rally Toward 4250+)
Conditions for upside:
Price must break and hold above 4055 (you marked this level).
Bullish structure resumes with higher lows.
Target moves:
1st target: 4160
2nd target: 4250
3rd target: Retest of the channel top near 4300–4330
Your blue arrow upward matches this exact pathway.
Why this can happen:
Price still respecting the ascending channel.
Mid-channel support is holding.
Buyers may step in near support.
📉 3. Bearish Scenario (Breakdown to 3920–3890 Zone)
This becomes active only if price breaks below the rising trendline around 4020–4010.
Bearish targets:
1st target: 3980
2nd target: 3920–3890 (your green demand zone)
This is a strong liquidity pool where buyers previously entered.
Your downward arrow correctly points toward this demand zone.
Why this can happen:
Rising wedge patterns often break down.
Momentum is currently weakening.
Massive liquidity below 4000.
🎯 4. What Is Most Likely Right Now?
Based on the chart:
✔ Price is testing support.
✔ Still inside the bullish channel.
✔ No confirmed breakdown yet.
➡ Bias: Short-term bullish unless 4020 breaks.
Once 4020 breaks cleanly → bearish continuation becomes very likely.
🧭 5. Simple Trading Plan (Based on Your Zones)
Bullish Setup
Buy above: 4055
SL: 4020
TP: 4160 → 4250 → 4320
Bearish Setup
Sell after breakdown below: 4020
SL: 4050
TP: 3980 → 3920 → 3890
For More Updates Stay Tuned
تم فتح الصفقة
h1 candle breakout 4055 dont miss buying opportunity أغلقت الصفقة: تم الوصول للهدف
1st target achived dont miss more updates stay alert
إخلاء المسؤولية
لا يُقصد بالمعلومات والمنشورات أن تكون، أو تشكل، أي نصيحة مالية أو استثمارية أو تجارية أو أنواع أخرى من النصائح أو التوصيات المقدمة أو المعتمدة من TradingView. اقرأ المزيد في شروط الاستخدام.
إخلاء المسؤولية
لا يُقصد بالمعلومات والمنشورات أن تكون، أو تشكل، أي نصيحة مالية أو استثمارية أو تجارية أو أنواع أخرى من النصائح أو التوصيات المقدمة أو المعتمدة من TradingView. اقرأ المزيد في شروط الاستخدام.