
📈
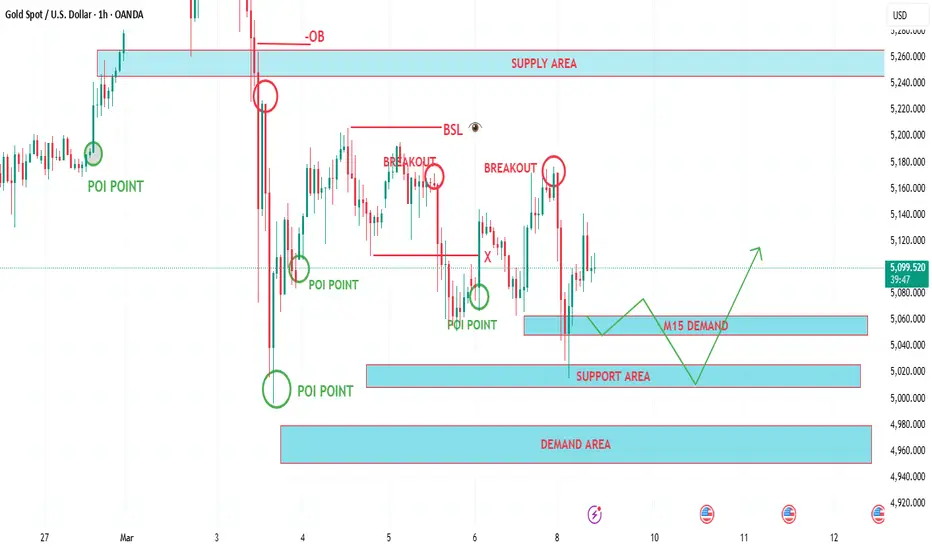
🔍 Market Structure & Key Observations
📉 Strong Rejection from Supply:
Gold previously faced a sharp rejection from the Supply Area 🔴 and the Order Block (OB), triggering a strong bearish move. This drop swept liquidity and pushed price toward deeper support zones.
🟢 Multiple POI Reactions:
Price has reacted several times from different Points of Interest (POI), showing that buyers are still defending key levels. These reactions indicate that the market is currently searching for a stable demand base.
👀 Buy-Side Liquidity (BSL):
Above the current price lies Buy-Side Liquidity (BSL), which often acts as a magnet for price once bullish momentum builds.
📦 Demand & Support Zones:
The chart highlights multiple support layers:
M15 Demand Zone around 5060
Major Support Area near 5020
Higher Timeframe Demand near 4960
These stacked demand zones increase the probability of a bullish reaction if price retraces into them.
⚡ Breakout Behavior:
Recent breakouts and failed breakouts show that the market is still consolidating and building liquidity before the next directional move.
🎯 Potential Scenario:
Price may retrace into the M15 Demand Zone or Support Area, collect liquidity, and then attempt a bullish move toward higher liquidity levels.
📊 Upside Target:
🎯 First Target: 5120 – Local resistance
🚀 Extended Target: 5180 – Buy-side liquidity zone
⚠️ Invalidation:
A strong breakdown below 5020 support could open the path toward the 4960 demand area.
🔍 Market Structure & Key Observations
📉 Strong Rejection from Supply:
Gold previously faced a sharp rejection from the Supply Area 🔴 and the Order Block (OB), triggering a strong bearish move. This drop swept liquidity and pushed price toward deeper support zones.
🟢 Multiple POI Reactions:
Price has reacted several times from different Points of Interest (POI), showing that buyers are still defending key levels. These reactions indicate that the market is currently searching for a stable demand base.
👀 Buy-Side Liquidity (BSL):
Above the current price lies Buy-Side Liquidity (BSL), which often acts as a magnet for price once bullish momentum builds.
📦 Demand & Support Zones:
The chart highlights multiple support layers:
M15 Demand Zone around 5060
Major Support Area near 5020
Higher Timeframe Demand near 4960
These stacked demand zones increase the probability of a bullish reaction if price retraces into them.
⚡ Breakout Behavior:
Recent breakouts and failed breakouts show that the market is still consolidating and building liquidity before the next directional move.
🎯 Potential Scenario:
Price may retrace into the M15 Demand Zone or Support Area, collect liquidity, and then attempt a bullish move toward higher liquidity levels.
📊 Upside Target:
🎯 First Target: 5120 – Local resistance
🚀 Extended Target: 5180 – Buy-side liquidity zone
⚠️ Invalidation:
A strong breakdown below 5020 support could open the path toward the 4960 demand area.
أغلقت الصفقة: تم الوصول للهدف
Market touched our zone and 1200+ smashed
join my telegram channel free
t.me/Pips_Profit_67
t.me/Pips_Profit_67
Daily 300+pips profits
weekly 2000+pips profit
High accuracy signals with double conformation
t.me/Pips_Profit_67
t.me/Pips_Profit_67
Daily 300+pips profits
weekly 2000+pips profit
High accuracy signals with double conformation
إخلاء المسؤولية
لا يُقصد بالمعلومات والمنشورات أن تكون، أو تشكل، أي نصيحة مالية أو استثمارية أو تجارية أو أنواع أخرى من النصائح أو التوصيات المقدمة أو المعتمدة من TradingView. اقرأ المزيد في شروط الاستخدام.
join my telegram channel free
t.me/Pips_Profit_67
t.me/Pips_Profit_67
Daily 300+pips profits
weekly 2000+pips profit
High accuracy signals with double conformation
t.me/Pips_Profit_67
t.me/Pips_Profit_67
Daily 300+pips profits
weekly 2000+pips profit
High accuracy signals with double conformation
إخلاء المسؤولية
لا يُقصد بالمعلومات والمنشورات أن تكون، أو تشكل، أي نصيحة مالية أو استثمارية أو تجارية أو أنواع أخرى من النصائح أو التوصيات المقدمة أو المعتمدة من TradingView. اقرأ المزيد في شروط الاستخدام.