
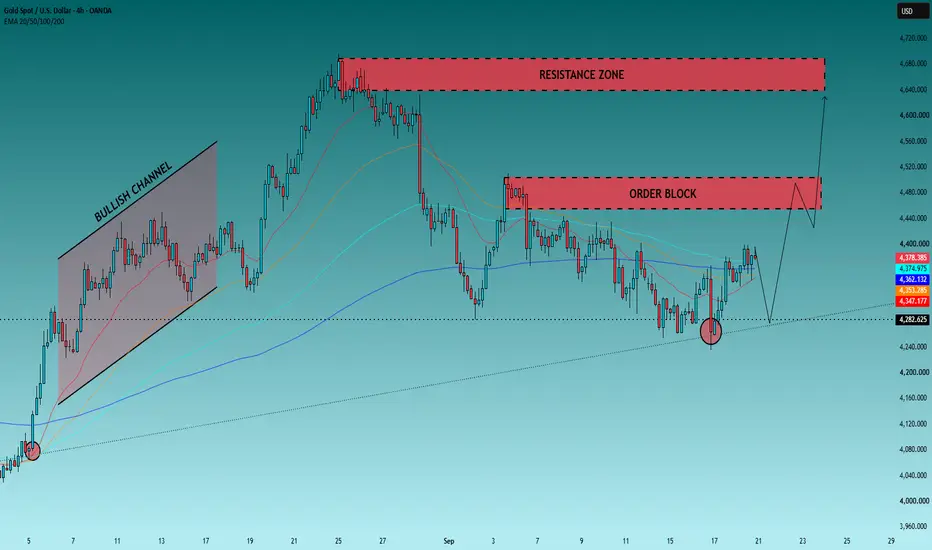
Gold is doing something interesting on this chart.
It is not breaking out.
It is not collapsing either.
Instead, price is rebuilding above a level that has already proved important — 4,282.
And that gives us a much cleaner way to trade the next move.
Forget trying to predict whether the next candle will be green or red. There are three doors on this chart:
4,282 → Survival
4,450–4,500 → Permission
4,630–4,680 → Destination
The trade depends on which door Gold opens first.
4,282 Is More Important Than It Looks
Look at the reaction around the recent low.
Gold pushed below the 4,282 area, tested the rising trendline and immediately recovered. Buyers did not simply defend the level — they forced price back toward the EMA cluster.
Price is now trading around 4,378, above the EMA 20/50/100/200 cluster shown on the chart.
That is constructive.
But I would not call Gold fully bullish yet.
Why?
Because buyers have recovered the middle of the battlefield, but they have not defeated the sellers waiting above.
The real problem starts around 4,450.
The Trap Is Between 4,400 and 4,450
This is where I think many traders could get caught.
A move above 4,400 will look bullish enough to attract breakout buyers.
But the major H4 Order Block sits roughly around 4,450–4,500.
That means buying blindly at 4,400 gives you very little information about whether Gold can actually break the important supply.
I want confirmation, not excitement.
BUY Scenario #1 — Buy the Pullback
I will consider a BUY if Gold pulls back toward 4,340–4,360, holds that area and then closes back above 4,380.
Entry: 4,375–4,385
SL: 4,335
TP1: 4,420
TP2: 4,455
TP3: 4,490
The idea is simple: the EMA cluster becomes support instead of resistance, giving buyers another attempt at the Order Block.
BUY Scenario #2 — Let Sellers Lose First
This is the setup I prefer for a larger bullish move.
Gold must break the 4,450–4,500 Order Block and produce a convincing H4 close above 4,500.
Then I want the breakout area to survive a retest.
Entry: 4,485–4,505 after confirmation
SL: 4,445
TP1: 4,560
TP2: 4,630
TP3: 4,680
Above 4,500, the chart changes considerably.
The next major destination becomes the upper 4,630–4,680 resistance zone, which is also where the previous major high was formed.
SELL Scenario — One Level Changes Everything
I am not interested in selling Gold simply because it reaches resistance.
The cleaner bearish trigger is 4,282.
If price returns there and we get an H4 close below 4,282, the recent recovery has failed and the rising trendline is no longer protecting buyers.
That would invalidate my bullish recovery thesis.
Entry: 4,275–4,285 on a failed retest from below
SL: 4,320
TP1: 4,240
TP2: 4,200
TP3: 4,160
There is also a more aggressive SELL opportunity at 4,450–4,500, but only if Gold reaches the Order Block and prints a clear rejection back below 4,440.
In that case:
Entry: 4,435–4,445
SL: 4,510
TP1: 4,380
TP2: 4,330
TP3: 4,285
My Map for Gold
Right now, I give buyers a slight advantage while price remains above 4,282 and the rising trendline.
But there is an important distinction:
4,282 keeps buyers alive.
4,500 puts buyers in control.
Until 4,500 breaks, the current rise is still a recovery into supply rather than a confirmed bullish continuation.
So I am not chasing Gold around 4,380.
I would rather buy a confirmed pullback, buy after sellers lose 4,500, or switch bearish if 4,282 finally gives way.
Three doors. Three completely different trades.
Which one do you think Gold opens first — 4,282 or 4,500?
It is not breaking out.
It is not collapsing either.
Instead, price is rebuilding above a level that has already proved important — 4,282.
And that gives us a much cleaner way to trade the next move.
Forget trying to predict whether the next candle will be green or red. There are three doors on this chart:
4,282 → Survival
4,450–4,500 → Permission
4,630–4,680 → Destination
The trade depends on which door Gold opens first.
4,282 Is More Important Than It Looks
Look at the reaction around the recent low.
Gold pushed below the 4,282 area, tested the rising trendline and immediately recovered. Buyers did not simply defend the level — they forced price back toward the EMA cluster.
Price is now trading around 4,378, above the EMA 20/50/100/200 cluster shown on the chart.
That is constructive.
But I would not call Gold fully bullish yet.
Why?
Because buyers have recovered the middle of the battlefield, but they have not defeated the sellers waiting above.
The real problem starts around 4,450.
The Trap Is Between 4,400 and 4,450
This is where I think many traders could get caught.
A move above 4,400 will look bullish enough to attract breakout buyers.
But the major H4 Order Block sits roughly around 4,450–4,500.
That means buying blindly at 4,400 gives you very little information about whether Gold can actually break the important supply.
I want confirmation, not excitement.
BUY Scenario #1 — Buy the Pullback
I will consider a BUY if Gold pulls back toward 4,340–4,360, holds that area and then closes back above 4,380.
Entry: 4,375–4,385
SL: 4,335
TP1: 4,420
TP2: 4,455
TP3: 4,490
The idea is simple: the EMA cluster becomes support instead of resistance, giving buyers another attempt at the Order Block.
BUY Scenario #2 — Let Sellers Lose First
This is the setup I prefer for a larger bullish move.
Gold must break the 4,450–4,500 Order Block and produce a convincing H4 close above 4,500.
Then I want the breakout area to survive a retest.
Entry: 4,485–4,505 after confirmation
SL: 4,445
TP1: 4,560
TP2: 4,630
TP3: 4,680
Above 4,500, the chart changes considerably.
The next major destination becomes the upper 4,630–4,680 resistance zone, which is also where the previous major high was formed.
SELL Scenario — One Level Changes Everything
I am not interested in selling Gold simply because it reaches resistance.
The cleaner bearish trigger is 4,282.
If price returns there and we get an H4 close below 4,282, the recent recovery has failed and the rising trendline is no longer protecting buyers.
That would invalidate my bullish recovery thesis.
Entry: 4,275–4,285 on a failed retest from below
SL: 4,320
TP1: 4,240
TP2: 4,200
TP3: 4,160
There is also a more aggressive SELL opportunity at 4,450–4,500, but only if Gold reaches the Order Block and prints a clear rejection back below 4,440.
In that case:
Entry: 4,435–4,445
SL: 4,510
TP1: 4,380
TP2: 4,330
TP3: 4,285
My Map for Gold
Right now, I give buyers a slight advantage while price remains above 4,282 and the rising trendline.
But there is an important distinction:
4,282 keeps buyers alive.
4,500 puts buyers in control.
Until 4,500 breaks, the current rise is still a recovery into supply rather than a confirmed bullish continuation.
So I am not chasing Gold around 4,380.
I would rather buy a confirmed pullback, buy after sellers lose 4,500, or switch bearish if 4,282 finally gives way.
Three doors. Three completely different trades.
Which one do you think Gold opens first — 4,282 or 4,500?

⚜️ Daily 4 - 6 Swing SIGNALS
⚜️ Daily 9 - 15 Scalping SIGNALS
⚜️ SMC - ICT | Document and Real Trade Logic
⚜️ Forex & Crypto & Gold | SIGNALS
Discussion Platform: t.me/+7toh_D6B6ew5MWQ1
⚜️ Daily 9 - 15 Scalping SIGNALS
⚜️ SMC - ICT | Document and Real Trade Logic
⚜️ Forex & Crypto & Gold | SIGNALS
Discussion Platform: t.me/+7toh_D6B6ew5MWQ1
إخلاء المسؤولية
لا يُقصد بالمعلومات والمنشورات أن تكون، أو تشكل، أي نصيحة مالية أو استثمارية أو تجارية أو أنواع أخرى من النصائح أو التوصيات المقدمة أو المعتمدة من TradingView. اقرأ المزيد في شروط الاستخدام.
⚜️ Daily 4 - 6 Swing SIGNALS
⚜️ Daily 9 - 15 Scalping SIGNALS
⚜️ SMC - ICT | Document and Real Trade Logic
⚜️ Forex & Crypto & Gold | SIGNALS
Discussion Platform: t.me/+7toh_D6B6ew5MWQ1
⚜️ Daily 9 - 15 Scalping SIGNALS
⚜️ SMC - ICT | Document and Real Trade Logic
⚜️ Forex & Crypto & Gold | SIGNALS
Discussion Platform: t.me/+7toh_D6B6ew5MWQ1
إخلاء المسؤولية
لا يُقصد بالمعلومات والمنشورات أن تكون، أو تشكل، أي نصيحة مالية أو استثمارية أو تجارية أو أنواع أخرى من النصائح أو التوصيات المقدمة أو المعتمدة من TradingView. اقرأ المزيد في شروط الاستخدام.