
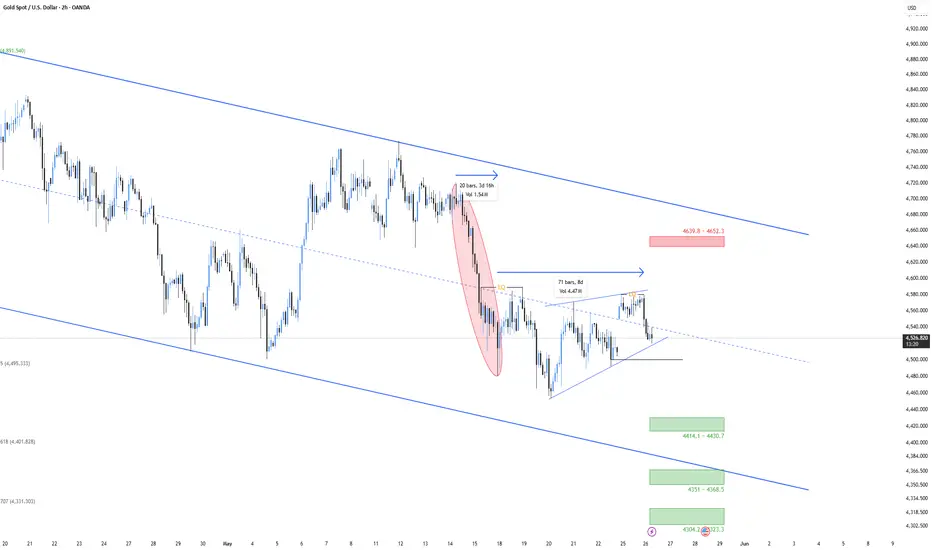
XAUUSD — Bearish Continuation Needs a Confirmed Breakdown
Macro Context
Gold is currently trading under a mixed but restrictive macro regime. The market is not pricing gold through a clean safe-haven channel. The dominant driver is a geopolitical inflation shock: renewed U.S.–Iran tension has pushed oil higher, and higher oil prices increase the risk that inflation remains sticky.
This matters because gold reacts differently to geopolitical risk depending on the transmission channel. If geopolitical stress creates pure risk-off demand, gold usually benefits. If the same geopolitical stress pushes energy prices higher and forces the market to price higher-for-longer interest rates, the benefit becomes weaker because the real-yield and USD channels start pressuring gold.
The current environment is closer to the second case.
The current catalyst should be classified as inflationary + policy-uncertain + growth-negative. This is not automatically bullish for gold. Gold needs either clear USD weakness, lower real-yield pressure, or a stronger risk-off shock to break higher with conviction.
Technical Structure
The chart shows gold trading inside a broader descending channel. The most important feature is the relationship between the prior bearish impulse and the current correction.
The previous bearish impulse developed in roughly 20 candles. After that, price spent almost 71 candles / 8 days inside a corrective phase. This is important because the correction consumed far more time than the impulse, but it failed to create a strong bullish structural reversal.
This creates a clear time divergence:
From a market-structure perspective, this suggests the current 8-day correction may be a redistribution / rebalancing phase after the impulse. The market may still need one more bearish leg to search for deeper liquidity and a stronger support base before a larger bullish rotation can develop.
Key Levels
Liquidity & Order-Flow Logic
The bearish idea is not based on chasing the current price. It requires confirmation.
The area below current price contains several minor liquidity pools. This means the path toward the channel floor is not necessarily clean. Each minor low can create a reaction, a short-term bounce, or a temporary pullback. For that reason, the market can move lower in steps rather than in one direct displacement.
This is the main execution risk for sellers.
The bearish continuation is valid only if price proves that the correction has ended. A weak wick below the wedge is not enough. The market needs a proper breakdown, acceptance below the corrective structure, and preferably a failed retest.
The strongest bearish confirmation comes if price breaks the corrective wedge, retests it from below, fails to reclaim it, and then prints another bearish displacement. That would show that the 8-day correction has likely completed and that the market is transitioning into a new impulse leg lower.
Primary Scenario
Bearish continuation after confirmed breakdown
The primary scenario remains bearish, but only after confirmation. The structure suggests downside potential, yet the market still needs to prove acceptance below the corrective wedge.
The logic behind this scenario is that the market has already built a long correction after a sharp bearish impulse. If this correction breaks down, sellers may attempt to drive price into deeper liquidity and stronger support before any larger bullish rotation becomes attractive.
However, the move should not be treated as automatic. The minor liquidity below price can slow the decline. The correct approach is to wait for structure confirmation, not to assume that the wedge will break immediately.
Alternative Scenario
Failed breakdown and bullish recovery
The bearish continuation scenario fails if sellers cannot break the wedge and price instead reclaims the local resistance structure.
If the market reclaims 4568–4585, the bearish wedge interpretation becomes weaker. In that case, the prior correction may transition into a broader recovery phase, especially if USD weakens and yields continue to move lower.
Scenario Framework
Continuation Scenario — Bearish
Reversal Scenario — Bullish
Positioning & Structural Bias
The distinction is important: the narrative is bearish, but the trade requires confirmation. Without a valid breakdown, price can continue rotating inside the correction and consuming minor liquidity.
Strategic Decision
The market should be classified as bearish corrective continuation, pending breakdown confirmation.
This is not a clean sell-at-market condition. The better framework is to wait for price to confirm that the 8-day correction has ended. A valid breakdown below the wedge would shift the setup from potential continuation to active continuation.
Conclusion
Gold is correcting after a sharp bearish impulse. The prior sell-off took roughly 20 candles, while the current correction has consumed around 71 candles / 8 days. This time divergence, combined with the wedge-like structure, supports the idea that the market may be preparing for another bearish leg.
The macro backdrop also supports caution on the bullish side. Oil-driven inflation risk, higher-for-longer rate expectations, and a supported dollar are limiting gold’s ability to develop a clean safe-haven rally.
The preferred scenario is a confirmed bearish breakdown toward 4414–4430, then the 4401 confluence zone. But confirmation is essential because the area below current price contains multiple minor liquidity pools that can slow the move and create short-term reactions.
Primary view: bearish continuation after confirmed breakdown.
Key confirmation: acceptance below 4520–4495.
Main target zone: 4414–4430, then 4401.
Major invalidation: strong reclaim and acceptance above 4568–4585.
Macro Context
Gold is currently trading under a mixed but restrictive macro regime. The market is not pricing gold through a clean safe-haven channel. The dominant driver is a geopolitical inflation shock: renewed U.S.–Iran tension has pushed oil higher, and higher oil prices increase the risk that inflation remains sticky.
This matters because gold reacts differently to geopolitical risk depending on the transmission channel. If geopolitical stress creates pure risk-off demand, gold usually benefits. If the same geopolitical stress pushes energy prices higher and forces the market to price higher-for-longer interest rates, the benefit becomes weaker because the real-yield and USD channels start pressuring gold.
The current environment is closer to the second case.
- USD Channel: The dollar remains supported by safe-haven demand and restrictive rate expectations. This reduces the upside impulse for gold.
- Real-Yields / Rate Channel: Higher-for-longer policy pricing is the most important bearish channel. Gold has no yield, so rising or sticky real-rate expectations reduce its relative attractiveness.
- Risk-Sentiment Channel: Geopolitical risk still provides structural support, but it is not strong enough yet to overpower the pressure from oil-driven inflation and rate repricing.
- Liquidity Channel: Higher energy prices act as a macro tightening mechanism. They reduce disposable liquidity, increase cost pressure, and keep central-bank policy uncertainty elevated.
The current catalyst should be classified as inflationary + policy-uncertain + growth-negative. This is not automatically bullish for gold. Gold needs either clear USD weakness, lower real-yield pressure, or a stronger risk-off shock to break higher with conviction.
Technical Structure
The chart shows gold trading inside a broader descending channel. The most important feature is the relationship between the prior bearish impulse and the current correction.
The previous bearish impulse developed in roughly 20 candles. After that, price spent almost 71 candles / 8 days inside a corrective phase. This is important because the correction consumed far more time than the impulse, but it failed to create a strong bullish structural reversal.
This creates a clear time divergence:
- The bearish impulse was fast, direct, and displacement-based.
- The recovery phase was slow, corrective, and overlapping.
- The correction took much more time but achieved limited upside progress.
- Price is still trading below the broader descending-channel resistance.
- The structure now resembles a bearish continuation wedge rather than bullish accumulation.
From a market-structure perspective, this suggests the current 8-day correction may be a redistribution / rebalancing phase after the impulse. The market may still need one more bearish leg to search for deeper liquidity and a stronger support base before a larger bullish rotation can develop.
Key Levels
- Current price area: 4520–4530
- Immediate decision zone: 4520–4495
- 0.5 retracement reference: near 4495.3
- Local bearish invalidation zone: 4568–4585
- Higher resistance / bullish recovery objective: 4639.8–4652.3
- First downside support target: 4414.4–4430.7
- Major confluence support: near 4401.3, where the larger 0.618 retracement aligns with the broader channel-floor region
- Lower support if momentum extends: 4351–4368.5
- Final lower liquidity zone: 4304.2–4323.3
Liquidity & Order-Flow Logic
The bearish idea is not based on chasing the current price. It requires confirmation.
The area below current price contains several minor liquidity pools. This means the path toward the channel floor is not necessarily clean. Each minor low can create a reaction, a short-term bounce, or a temporary pullback. For that reason, the market can move lower in steps rather than in one direct displacement.
This is the main execution risk for sellers.
The bearish continuation is valid only if price proves that the correction has ended. A weak wick below the wedge is not enough. The market needs a proper breakdown, acceptance below the corrective structure, and preferably a failed retest.
- A wick below the wedge without acceptance is only a liquidity sweep.
- A close below the corrective structure with displacement is the first bearish signal.
- Acceptance below 4520–4495 strengthens the breakdown.
- A failed retest of the broken wedge confirms seller control.
- A clean move through the 4495.3 region opens the path toward 4430–4414.
The strongest bearish confirmation comes if price breaks the corrective wedge, retests it from below, fails to reclaim it, and then prints another bearish displacement. That would show that the 8-day correction has likely completed and that the market is transitioning into a new impulse leg lower.
Primary Scenario
Bearish continuation after confirmed breakdown
The primary scenario remains bearish, but only after confirmation. The structure suggests downside potential, yet the market still needs to prove acceptance below the corrective wedge.
- Trigger: price breaks below the local wedge / corrective structure with displacement.
- First confirmation: acceptance below 4520–4495.
- Continuation confirmation: failed retest of the broken wedge or broken support, followed by renewed bearish displacement.
- Target 1: 4414.4–4430.7.
- Target 2: 4401.3, where the larger 0.618 retracement aligns with the broader channel-floor region.
- Target 3: 4351–4368.5 only if price breaks and accepts below the first support reaction.
- Extended target: 4304.2–4323.3 if the channel-floor confluence fails with strong bearish continuation.
The logic behind this scenario is that the market has already built a long correction after a sharp bearish impulse. If this correction breaks down, sellers may attempt to drive price into deeper liquidity and stronger support before any larger bullish rotation becomes attractive.
However, the move should not be treated as automatic. The minor liquidity below price can slow the decline. The correct approach is to wait for structure confirmation, not to assume that the wedge will break immediately.
Alternative Scenario
Failed breakdown and bullish recovery
The bearish continuation scenario fails if sellers cannot break the wedge and price instead reclaims the local resistance structure.
- Trigger: price reclaims 4568–4585 with strong displacement.
- Confirmation: price holds above 4568–4585 and converts the zone into support.
- Upside objective: 4639.8–4652.3.
- Further bullish confirmation: acceptance above 4652.3, which would show that the correction was not a bearish continuation wedge but a stronger accumulation base.
- Invalidation of bullish recovery: reclaim above 4568–4585 followed by a fast rejection back below the zone.
If the market reclaims 4568–4585, the bearish wedge interpretation becomes weaker. In that case, the prior correction may transition into a broader recovery phase, especially if USD weakens and yields continue to move lower.
Scenario Framework
Continuation Scenario — Bearish
- Condition required: price must remain below 4568–4585.
- Trigger: breakdown below the wedge.
- Confirmation: acceptance below 4520–4495 and failure to reclaim the broken structure.
- First objective: 4430–4414.
- Main objective: 4401 / 0.618 / channel-floor confluence.
- Invalidation: strong reclaim above 4568–4585.
Reversal Scenario — Bullish
- Condition required: sellers fail to break the wedge and buyers reclaim resistance.
- Trigger: displacement above 4568–4585.
- Confirmation: hold above that zone after retest.
- First objective: 4639.8–4652.3.
- Structural confirmation: acceptance above 4652.3.
- Invalidation: rejection below 4568 after reclaim.
Positioning & Structural Bias
- Intraday bias: neutral-to-bearish while price trades below 4568–4585.
- Short-term structural bias: bearish continuation setup, but not confirmed yet.
- Medium-term bias: bearish while price remains inside the broader descending channel.
- Narrative bias: gold may need one more leg lower to collect liquidity and find a stronger support base.
- Structural confirmation needed: breakdown below the corrective wedge and acceptance below 4520–4495.
The distinction is important: the narrative is bearish, but the trade requires confirmation. Without a valid breakdown, price can continue rotating inside the correction and consuming minor liquidity.
Strategic Decision
The market should be classified as bearish corrective continuation, pending breakdown confirmation.
This is not a clean sell-at-market condition. The better framework is to wait for price to confirm that the 8-day correction has ended. A valid breakdown below the wedge would shift the setup from potential continuation to active continuation.
- Below 4568–4585, sellers keep structural control.
- Below 4520–4495, bearish continuation becomes more credible.
- Below 4495.3 with displacement, the path opens toward 4430–4414.
- Near 4401, sellers should be more cautious because the 0.618 and channel-floor confluence can produce a strong reaction.
Conclusion
Gold is correcting after a sharp bearish impulse. The prior sell-off took roughly 20 candles, while the current correction has consumed around 71 candles / 8 days. This time divergence, combined with the wedge-like structure, supports the idea that the market may be preparing for another bearish leg.
The macro backdrop also supports caution on the bullish side. Oil-driven inflation risk, higher-for-longer rate expectations, and a supported dollar are limiting gold’s ability to develop a clean safe-haven rally.
The preferred scenario is a confirmed bearish breakdown toward 4414–4430, then the 4401 confluence zone. But confirmation is essential because the area below current price contains multiple minor liquidity pools that can slow the move and create short-term reactions.
Primary view: bearish continuation after confirmed breakdown.
Key confirmation: acceptance below 4520–4495.
Main target zone: 4414–4430, then 4401.
Major invalidation: strong reclaim and acceptance above 4568–4585.
ملاحظة

For live market updates and high-probability setups, join my Telegram: t.me/G_Traders
منشورات ذات صلة
إخلاء المسؤولية
لا يُقصد بالمعلومات والمنشورات أن تكون، أو تشكل، أي نصيحة مالية أو استثمارية أو تجارية أو أنواع أخرى من النصائح أو التوصيات المقدمة أو المعتمدة من TradingView. اقرأ المزيد في شروط الاستخدام.
For live market updates and high-probability setups, join my Telegram: t.me/G_Traders
منشورات ذات صلة
إخلاء المسؤولية
لا يُقصد بالمعلومات والمنشورات أن تكون، أو تشكل، أي نصيحة مالية أو استثمارية أو تجارية أو أنواع أخرى من النصائح أو التوصيات المقدمة أو المعتمدة من TradingView. اقرأ المزيد في شروط الاستخدام.