
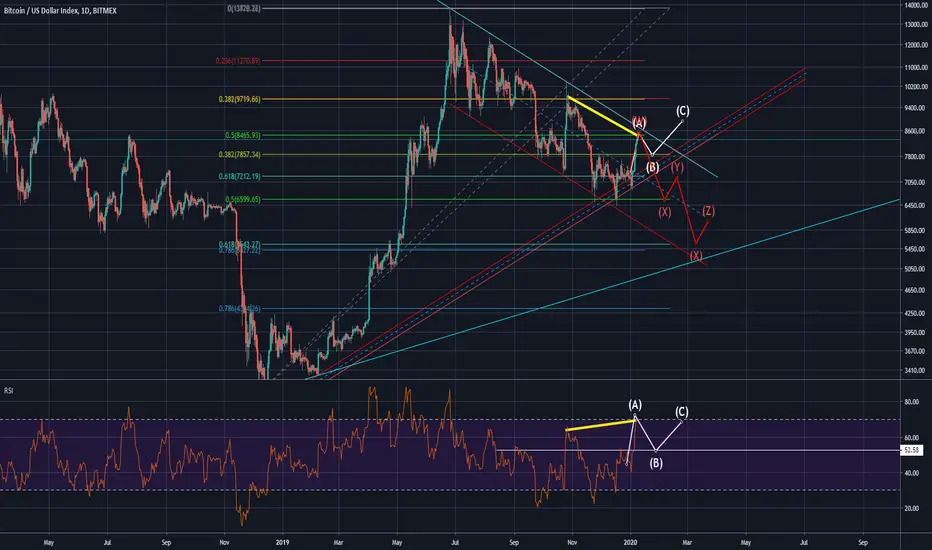
On the daily, the RSI is reaching an overbought condition that suggests the linear .5 around 8500 is acting as resistance. The fat yellow lines represent the angular divergence between the price and the RSI. I’ve used an ABC Elliot wave tool to highlight a likely trajectory the price could take. I’ve also made a bearish argument with a triple combo wave tool. Gotta keep the moon boys in check.

إخلاء المسؤولية
لا يُقصد بالمعلومات والمنشورات أن تكون، أو تشكل، أي نصيحة مالية أو استثمارية أو تجارية أو أنواع أخرى من النصائح أو التوصيات المقدمة أو المعتمدة من TradingView. اقرأ المزيد في شروط الاستخدام.
إخلاء المسؤولية
لا يُقصد بالمعلومات والمنشورات أن تكون، أو تشكل، أي نصيحة مالية أو استثمارية أو تجارية أو أنواع أخرى من النصائح أو التوصيات المقدمة أو المعتمدة من TradingView. اقرأ المزيد في شروط الاستخدام.