
Text me if you have any questions/comments for me.
-----
XRF
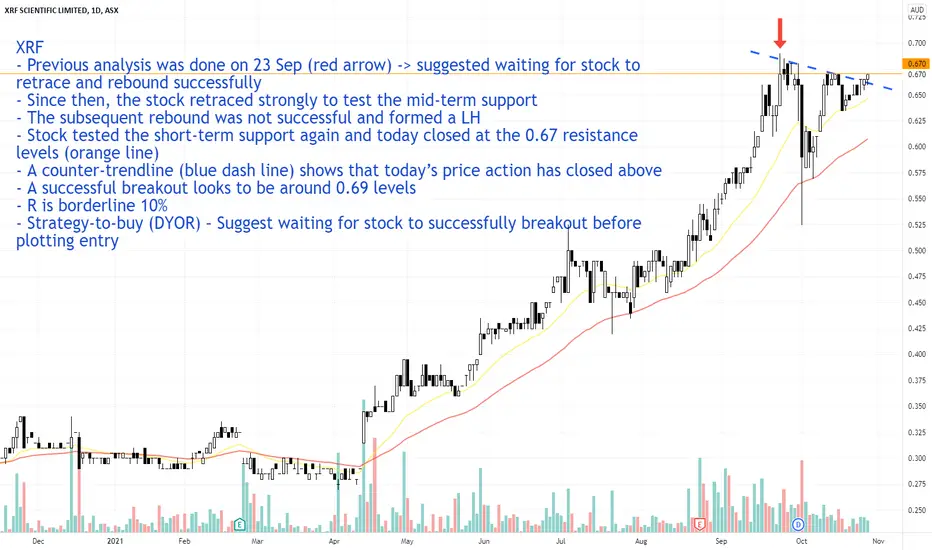
- Previous analysis was done on 23 Sep (red arrow) -> suggested waiting for stock to retrace and rebound successfully
- Since then, the stock retraced strongly to test the mid-term support
- The subsequent rebound was not successful and formed a LH
- Stock tested the short-term support again and today closed at the 0.67 resistance levels (orange line)
- A counter-trendline (blue dash line) shows that today’s price action has closed above
- A successful breakout looks to be around 0.69 levels
- R is borderline 10%
- Strategy-to-buy (DYOR) – Suggest waiting for stock to successfully breakout before plotting entry

إخلاء المسؤولية
لا يُقصد بالمعلومات والمنشورات أن تكون، أو تشكل، أي نصيحة مالية أو استثمارية أو تجارية أو أنواع أخرى من النصائح أو التوصيات المقدمة أو المعتمدة من TradingView. اقرأ المزيد في شروط الاستخدام.
إخلاء المسؤولية
لا يُقصد بالمعلومات والمنشورات أن تكون، أو تشكل، أي نصيحة مالية أو استثمارية أو تجارية أو أنواع أخرى من النصائح أو التوصيات المقدمة أو المعتمدة من TradingView. اقرأ المزيد في شروط الاستخدام.